
We've been working with data for quite a while. The trouble is, we haven't always understood what that meant.
At first it seemed fairly straightforward: there is data, often lots of it, often incomprehensible, and someone has to find a way to make it readable. In our case, that someone was us.
You take some data, analyse it, find a structure, choose what to show and what to leave out, build a visualization and try to tell people something. It's what we call information design, and for years it accounted for a good part of our work.
Then, through working, we began to notice that data could play very different roles within a project. Perhaps the interesting part wasn't so much designing with data as designing for and through it. Three small words for a question we've been carrying around for a few years.
Designing with data
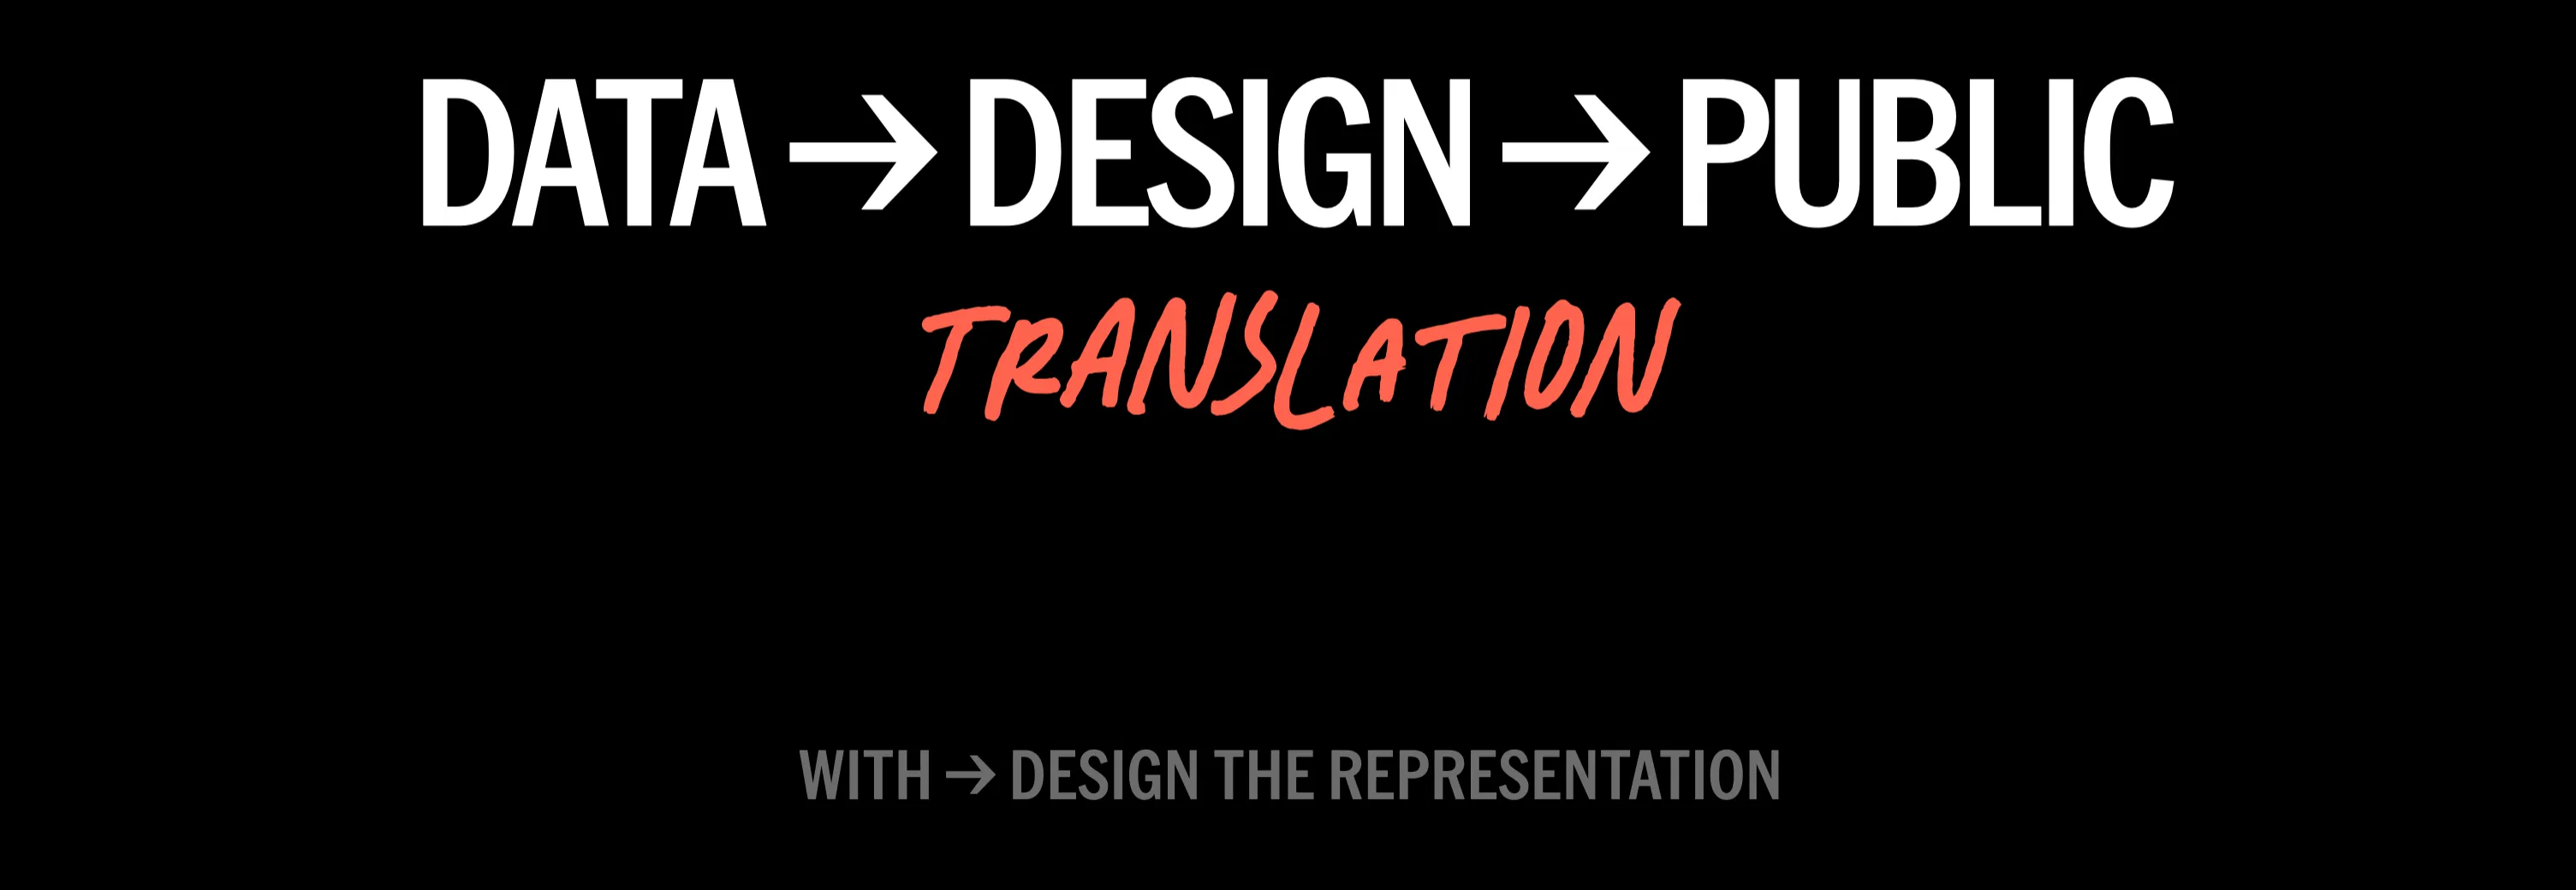
With is probably where we started. Designing with data means taking information that already exists and trying to make it accessible, interpretable and explorable. Here, data is the material we design with.
Think, for example, of street names in European cities and what they can tell us about who is remembered in public space and, above all, who isn't. The data already exists, scattered across OpenStreetMap, Wikidata and other sources. The work is to bring it together, put it in context and build a way to explore it, as we tried to do with Mapping Diversity.
That doesn't mean the person looking is passive. They can question what they see, compare it with their own experience, ask a question. Sometimes they point out missing or inaccurate information and help correct the data itself, as happened with the street names.
But the main direction of knowledge transfer remains top-down: from those who collect, analyse and organise the information to those who consult it. A little like a book, except here shapes, positions and colours do some of the work. The reader can explore and interpret, but the starting point and the framing have been established elsewhere.
Designing for data
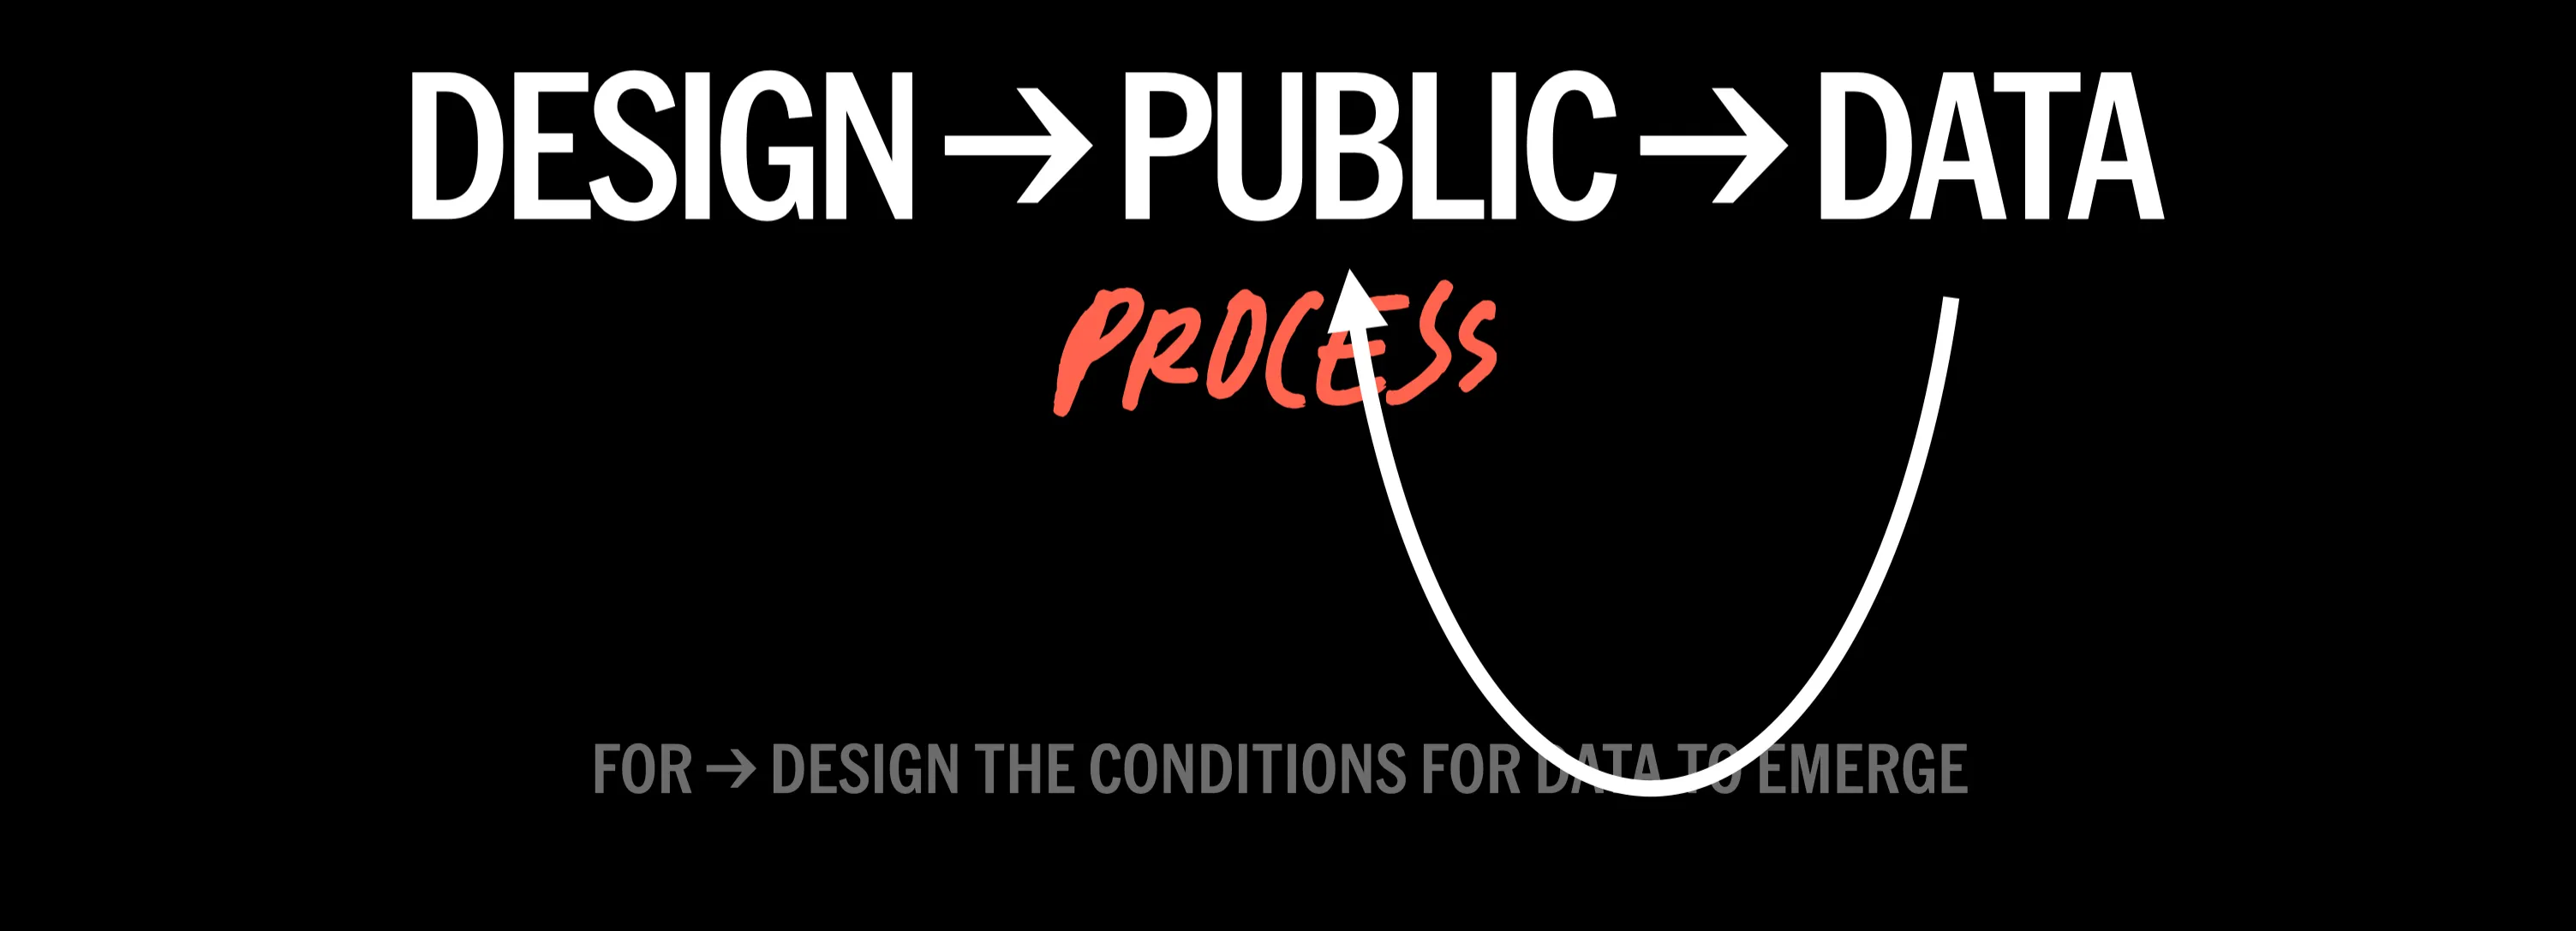
At some point we started working the other way round too: what if the data, rather than already being there, were the outcome of the project?
Designing for data means creating, before the final visualization, the conditions for data to emerge: a question, a space, some materials, rules, an interaction. The designer builds the system, but the people taking part produce the data and gradually give the representation its shape.
Think of children and school communities physically contributing to a visualization, adding experiences, perceptions, memories and wishes connected to their school playground, as happened in some of the activities for Cortili in Azione. The outcome isn't decided in advance: it emerges from the people taking part, in that place and at that moment.
Of course, this doesn't automatically make the process democratic, inclusive or, another particularly dangerous word, participatory. We're still the ones deciding the question, categories, materials and possible answers. Getting someone to stick up a Post-it note doesn't mean you've handed over power. But the relationship changes.
Here, knowledge transfer is primarily bottom-up: from people's experiences and knowledge towards a shared representation, those running the project or those who will have to make a decision. We're not simply making something we already know accessible: we're creating the conditions to learn something we wouldn't know without those contributions. Provided, of course, we're willing to listen to answers we hadn't anticipated.
Designing through data
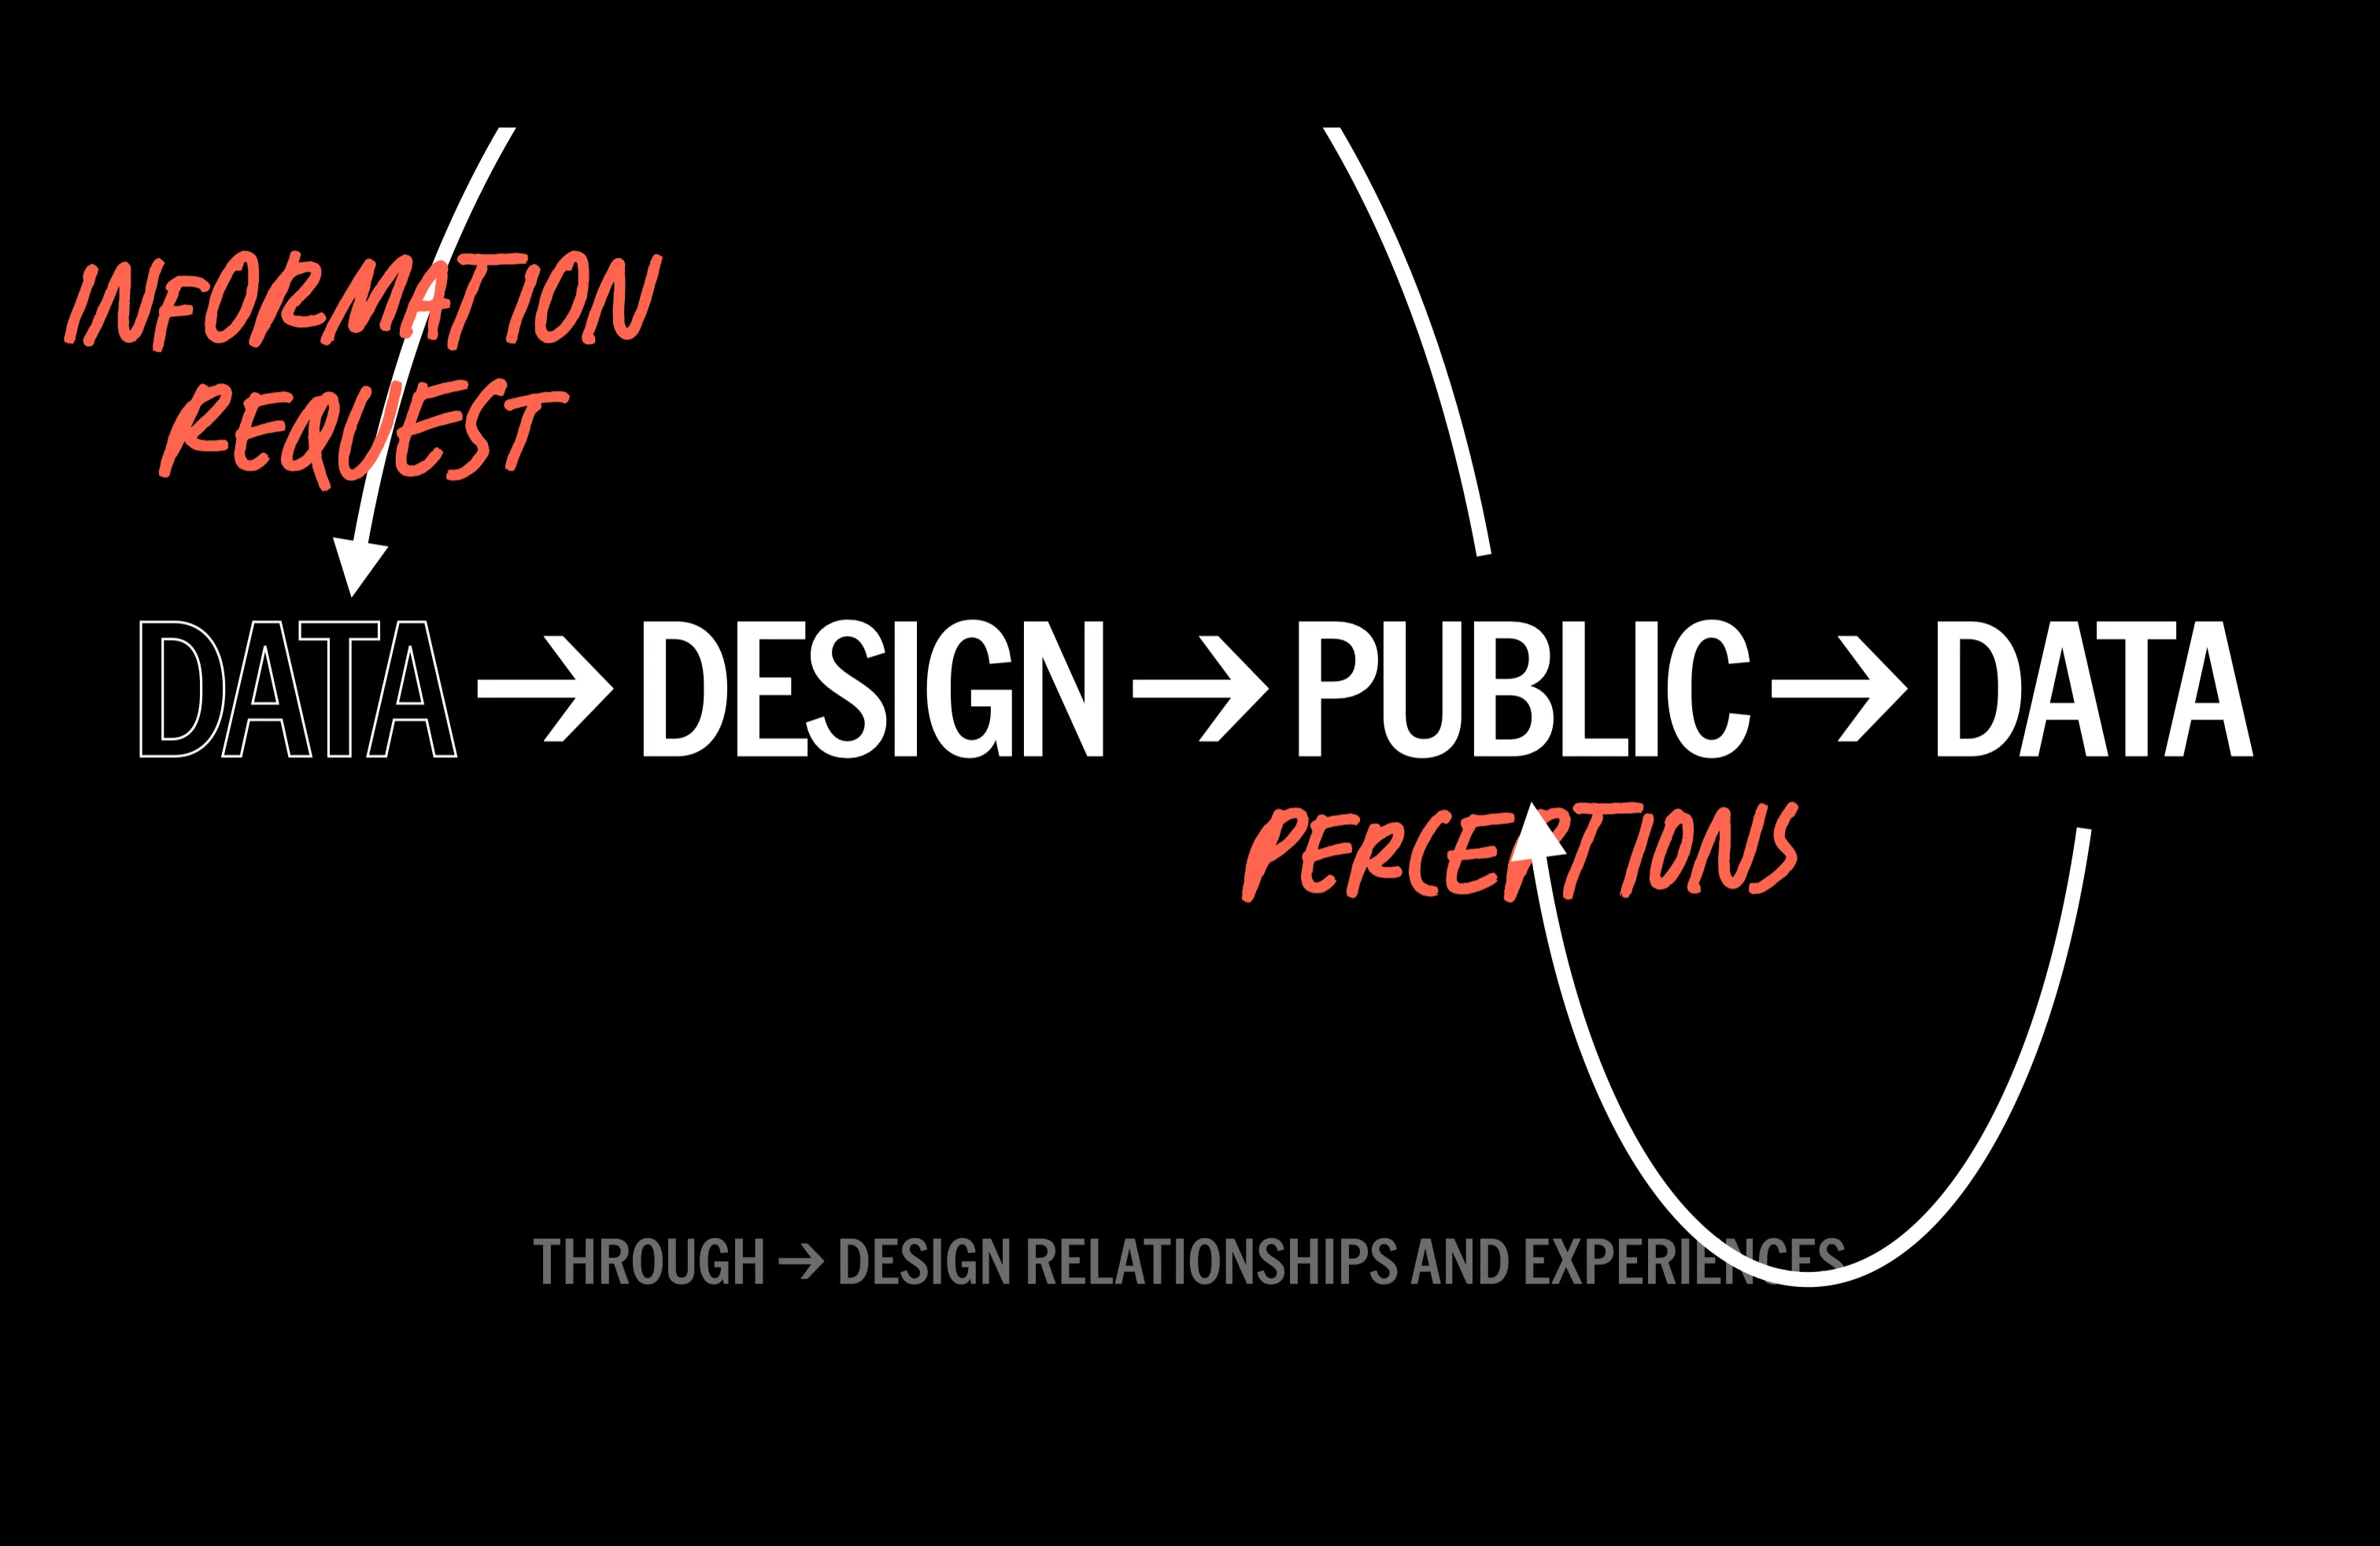
Then we arrived at through, which is perhaps the part that interests us most at the moment.
Here the data already exists, but we initially keep it hidden. Before showing it, we invite people to guess, make an estimate, express their perception of the phenomenon it describes. That's what we did with our questions about water for the Sete Festival. How many litres does it take to produce a particular thing? We have the answer, but it can wait a moment.
Asking for an estimate does two things. First, to answer, you have to engage with the phenomenon. Perhaps you've never thought about it, but now you have to imagine a quantity, draw on something you know, decide what seems plausible. Even coming up with a completely wrong number means you've stopped to think about it. Which, for a piece of data, is already quite an achievement.
The second comes afterwards. Once you've committed to an answer, you want to know whether you got it right. A specific gap opens up between what you think you know and the answer you haven't seen yet. Curiosity also comes from that small piece of unfinished business.
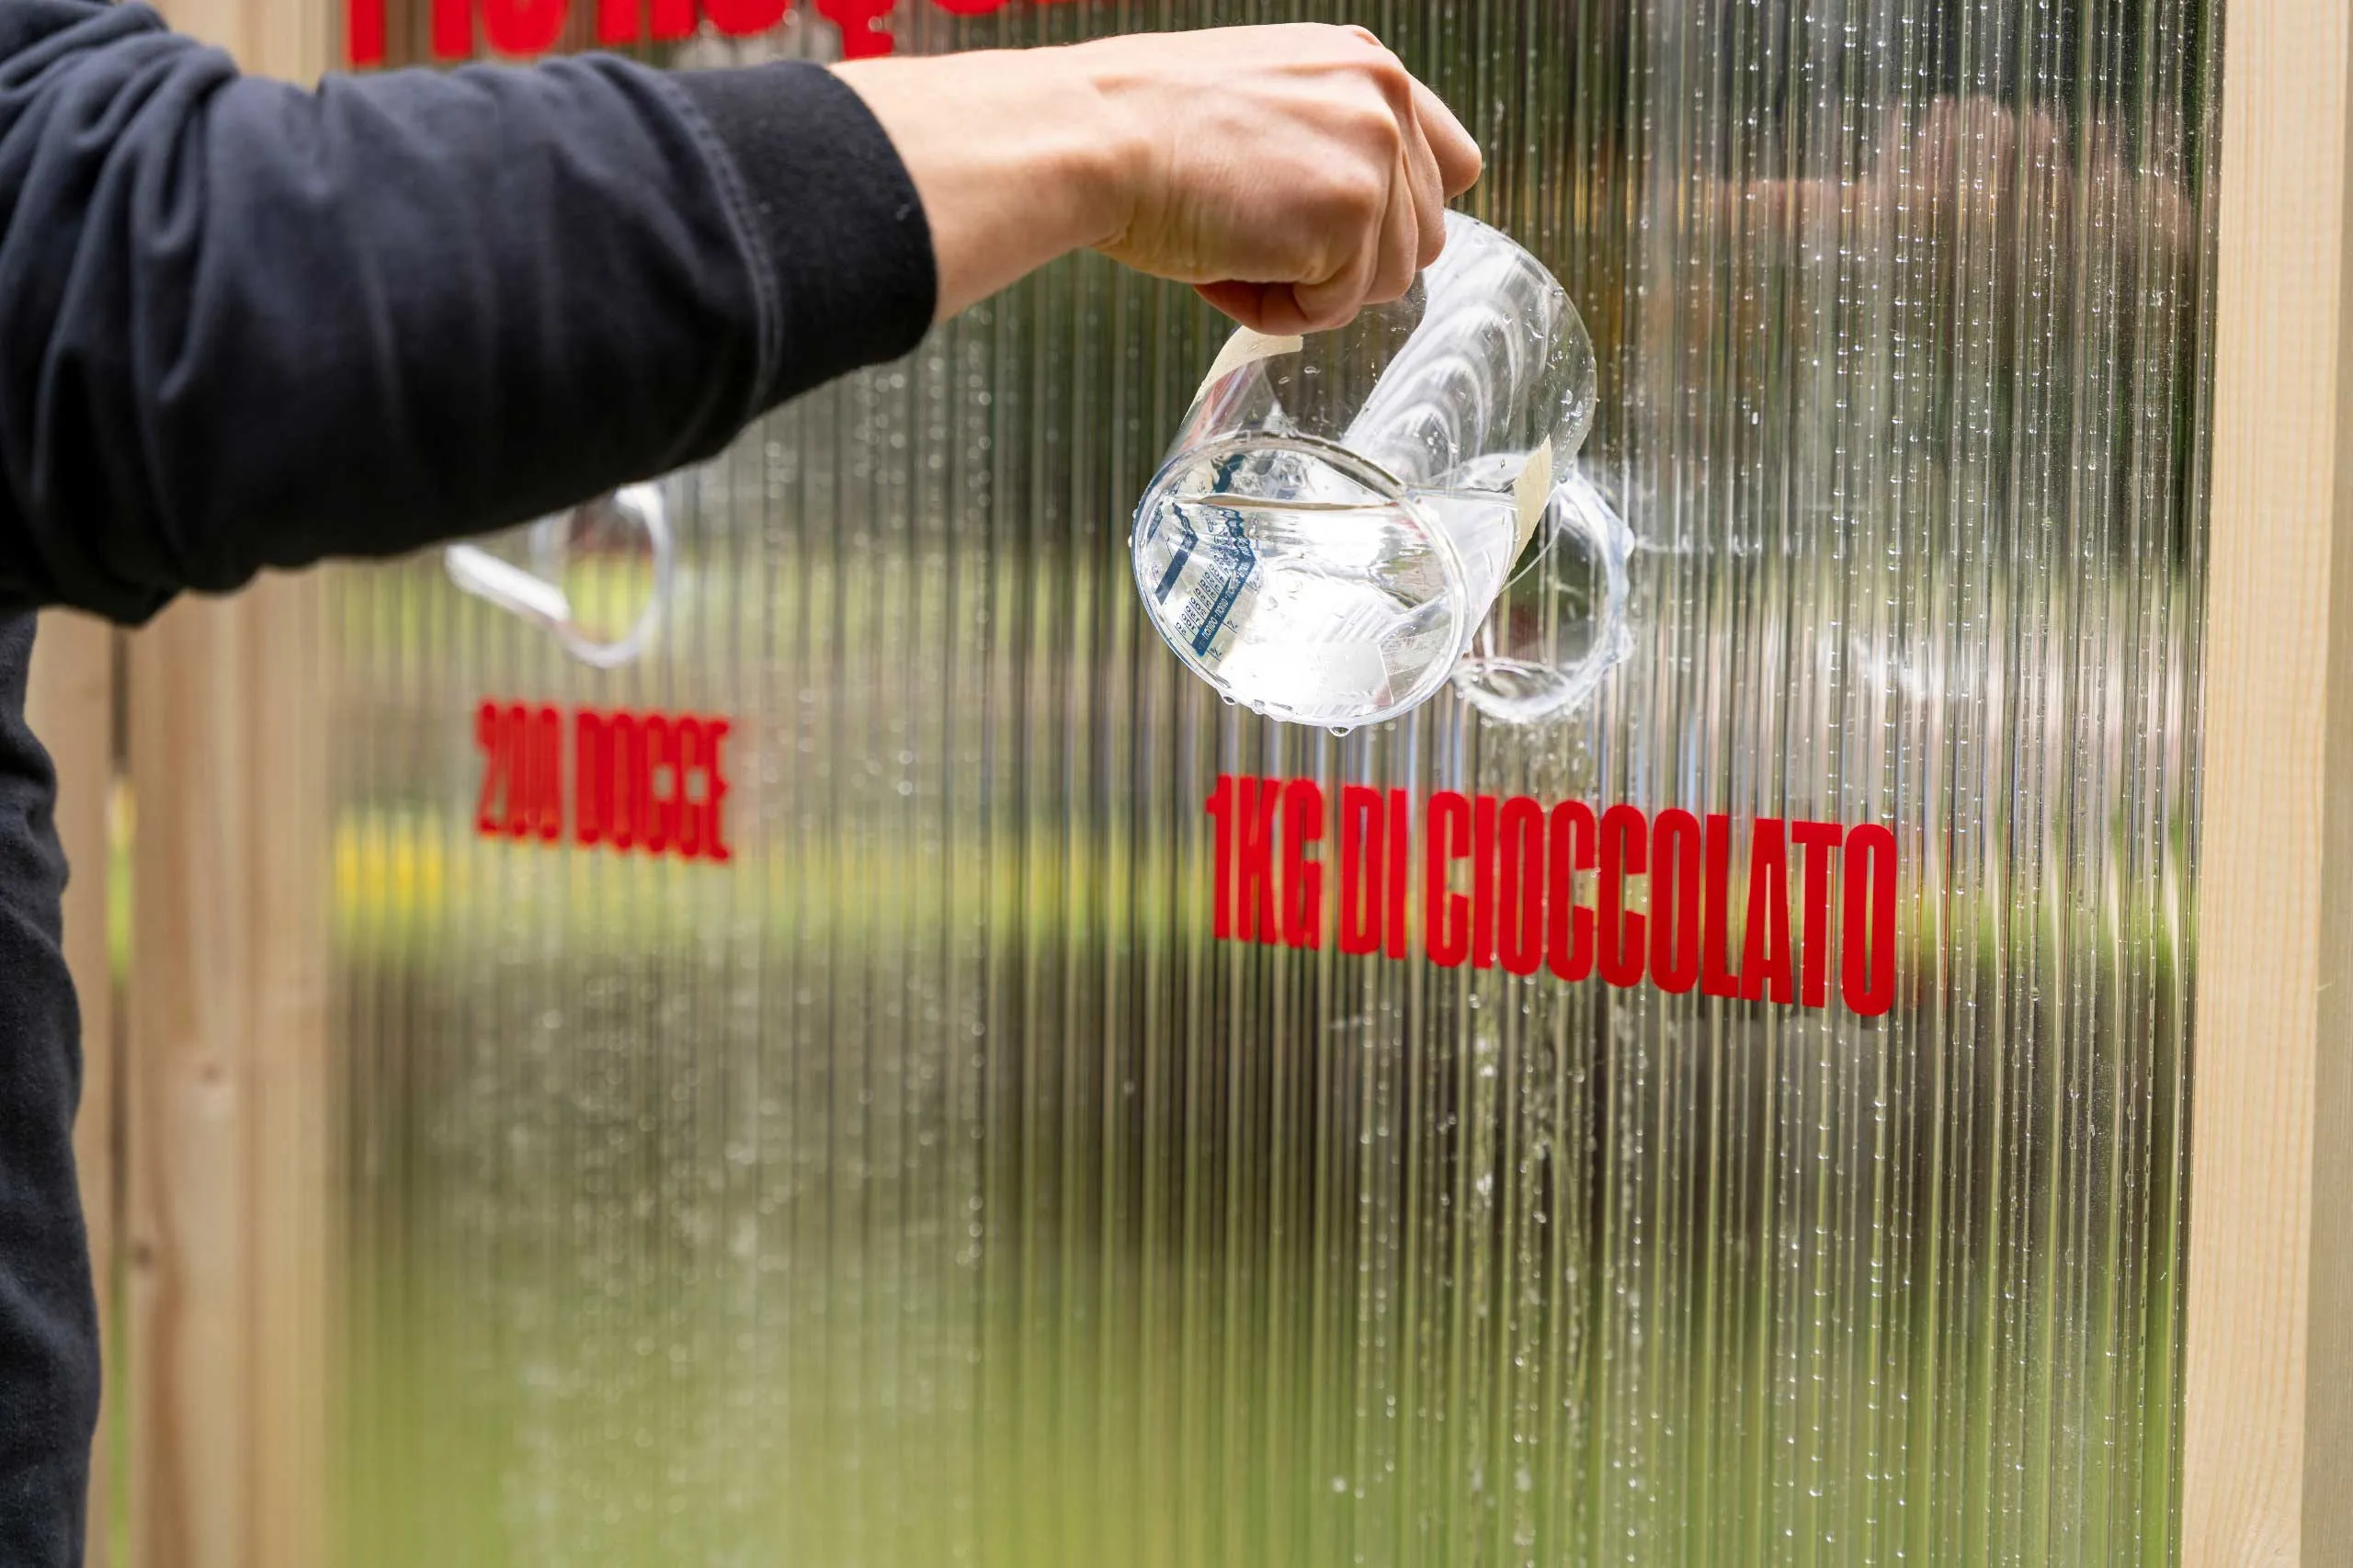
At this point, we're no longer simply the ones wanting to communicate the information: the audience wants to know it. The request comes from below, bottom-up. The data arrives at the end of the process and answers that request, activating a top-down transfer of knowledge.
Perhaps you were right, perhaps you were miles off, or perhaps the number seems absurd and you want to know where it came from. Either way, that number now answers a question that has become yours too.
The point isn't to show people how ignorant they are, an activity the world already provides plenty of opportunities for. It's to create a reason to want to know.
So?
With, for and through aren't three rungs on a ladder, and through isn't the premium version of with. They are three ways of thinking about what data does within a project, but also about how knowledge is transferred, and in which direction.
In with, the movement is mainly top-down: we start with knowledge that has already been collected and organised, and design a way to make it accessible to other people.
In for, the movement is mainly bottom-up: we design the conditions for people's knowledge and experiences to emerge, become data and contribute to a shared understanding of the problem.
In through, the two movements form a sequence: a request for information emerges from the audience, bottom-up, and revealing the data answers it with a top-down transfer of knowledge.
Often, of course, the three overlap. A project can start with existing data and then allow people to change it, just as a participatory visualization can produce new data while also communicating something. The categories help us think, rather than sort projects into three boxes.
Perhaps this is what has changed most in the way we work. For a long time, we asked ourselves how to represent data well. We still do, obviously, but that's no longer enough. We want to understand who brings knowledge into a project, who receives it and what opportunities they have to respond, correct it or question it.
In the end, a piece of data does very little on its own: it only becomes interesting through the connections it makes.
Follow us on
Instagram
LinkedIn
Spotify