
Fifteen years ago, there was a lot of talk about open data. The idea, vastly simplified, was wonderful: make data accessible to everyone and something will happen. Researchers, journalists, businesses, organisations and citizens will be able to use it, combine it and turn it into services, knowledge, accountability and participation. Some of that happened, and today we have access to an amount of data that would have been hard even to imagine fifteen years ago.
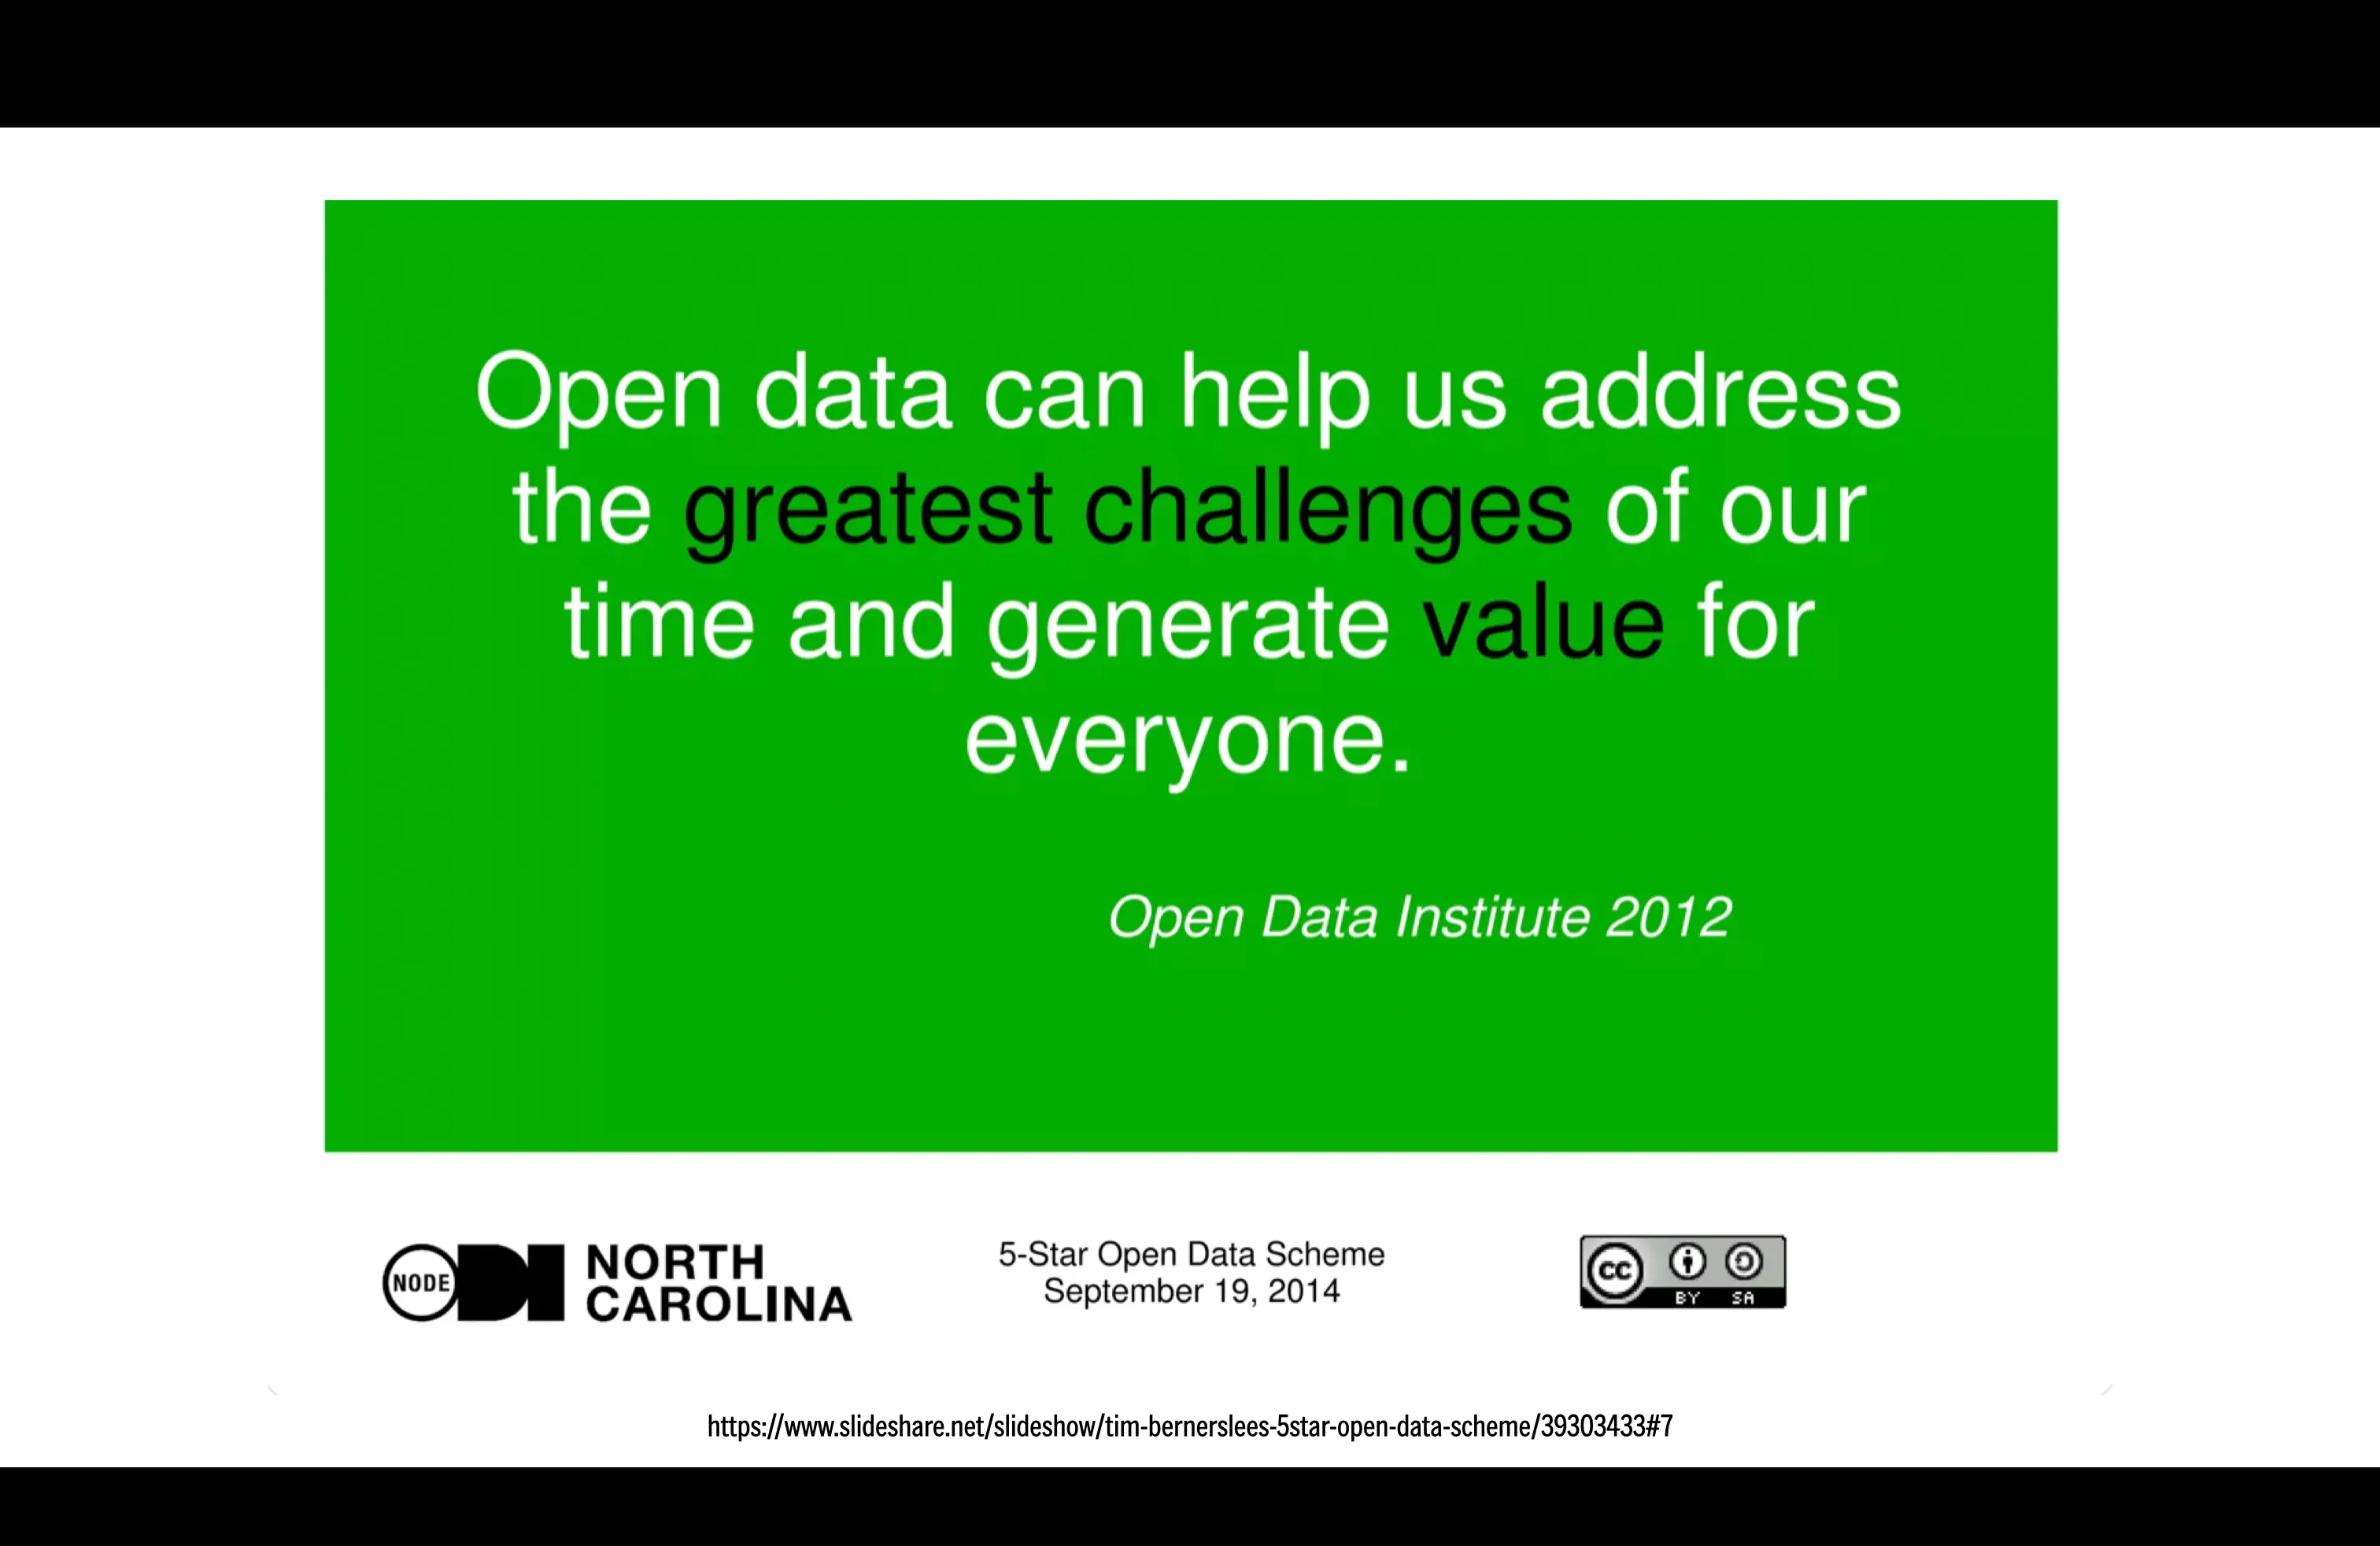
Source: Open Data Institute quotation (2012), from the presentation “Tim Berners-Lee’s 5-Star Open Data Scheme”, ODI Node North Carolina, 19 September 2014, CC BY-SA licence.
Along the way, though, we noticed something fairly obvious: open doesn't necessarily mean accessible. A CSV on a public authority's website is technically open data, as is a table with 400 columns or a portal where finding a number takes twenty steps. We can download it, so it's open. Whether we can make any sense of it is another matter.
And even when we can read it, that doesn't necessarily mean we can interpret it.
When data tells the opposite story
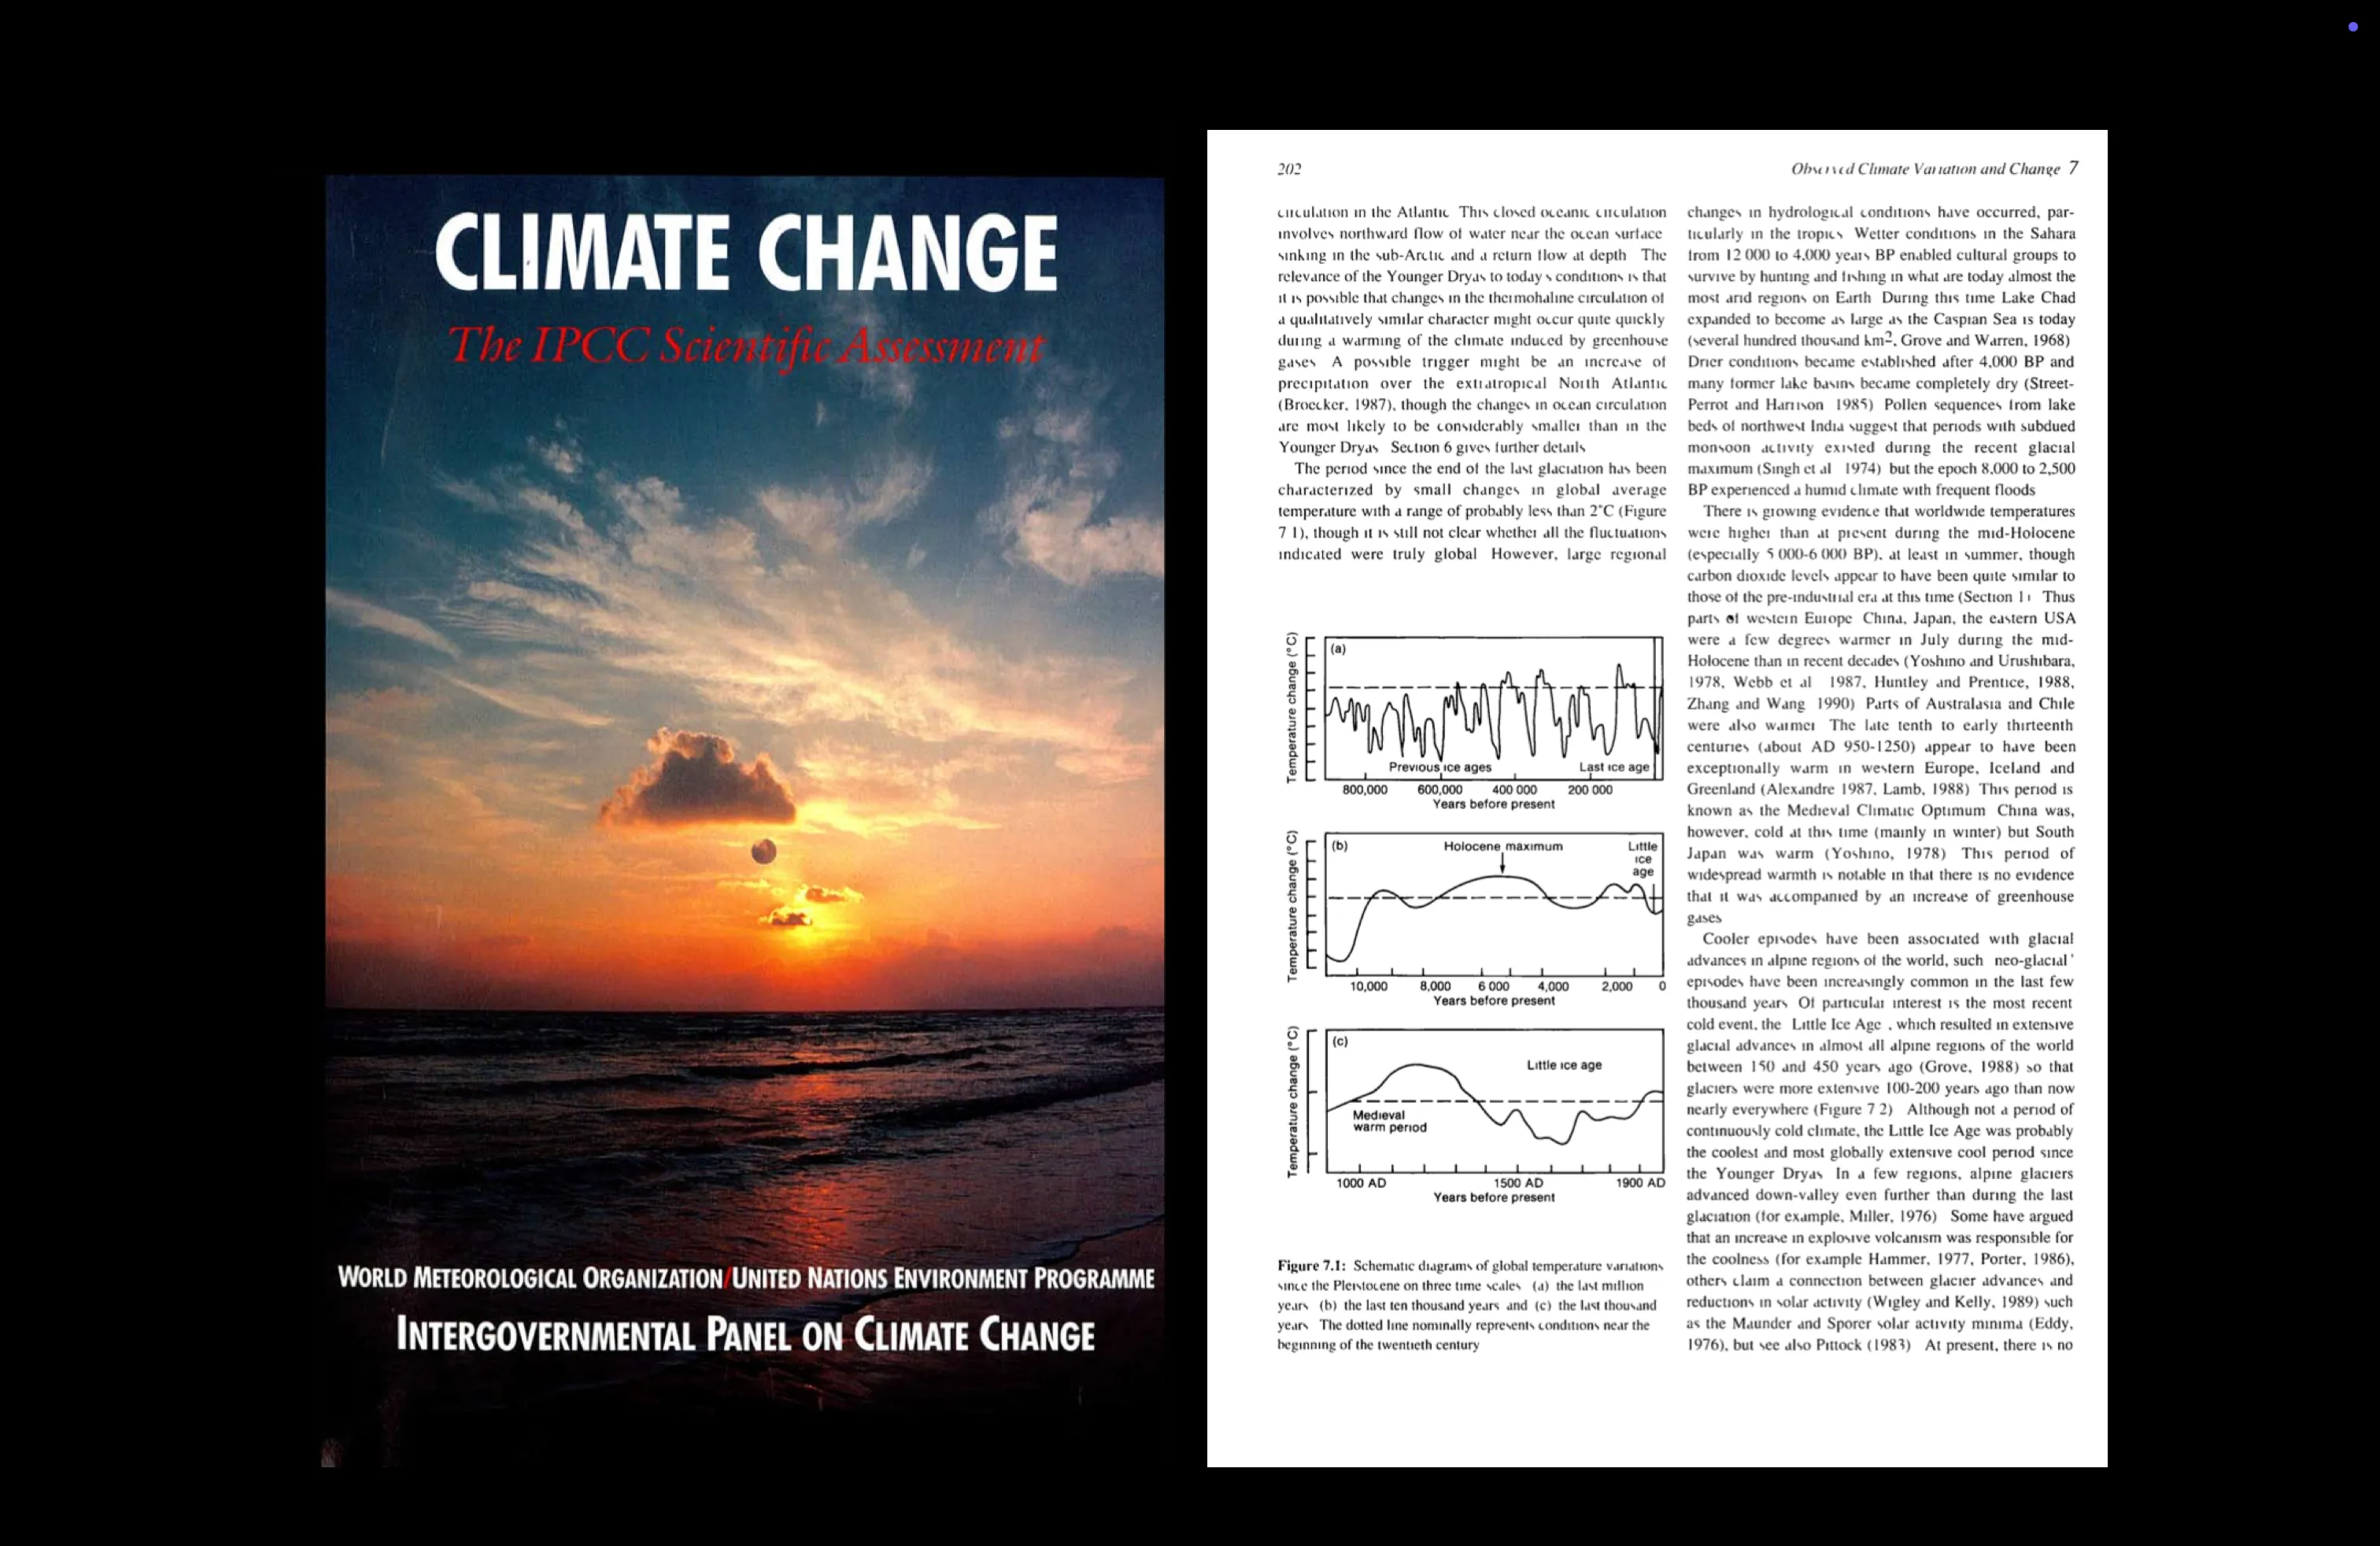
One example illustrates rather well why opening up data isn't enough. In 1990, the IPCC published its first Assessment Report on climate change, bringing together the available scientific knowledge on global warming and the role of human activity.
On page 202, in the chapter Observed Climate Variation and Change, figure 7.1 shows schematic representations of temperature variations over different timescales. One panel includes the Medieval Warm Period and the Little Ice Age. The important word is schematic: this isn't a modern quantitative reconstruction of global mean temperature, but a representation based on the palaeoclimatic knowledge available at the time, which was also far more geographically limited. The report's text is more cautious than the figure viewed in isolation might suggest, noting uncertainty over whether some of those fluctuations were truly global.
Twenty-one years later, on 22 August 2011, a reinterpretation of that curve appeared on a placard outside Australia's Parliament House in Canberra. The photograph was taken during the Convoy of No Confidence, a protest against government policies including the proposed carbon tax. Alongside the chart, other placards claimed that CO₂ was not a pollutant and disputed its role in climate change.
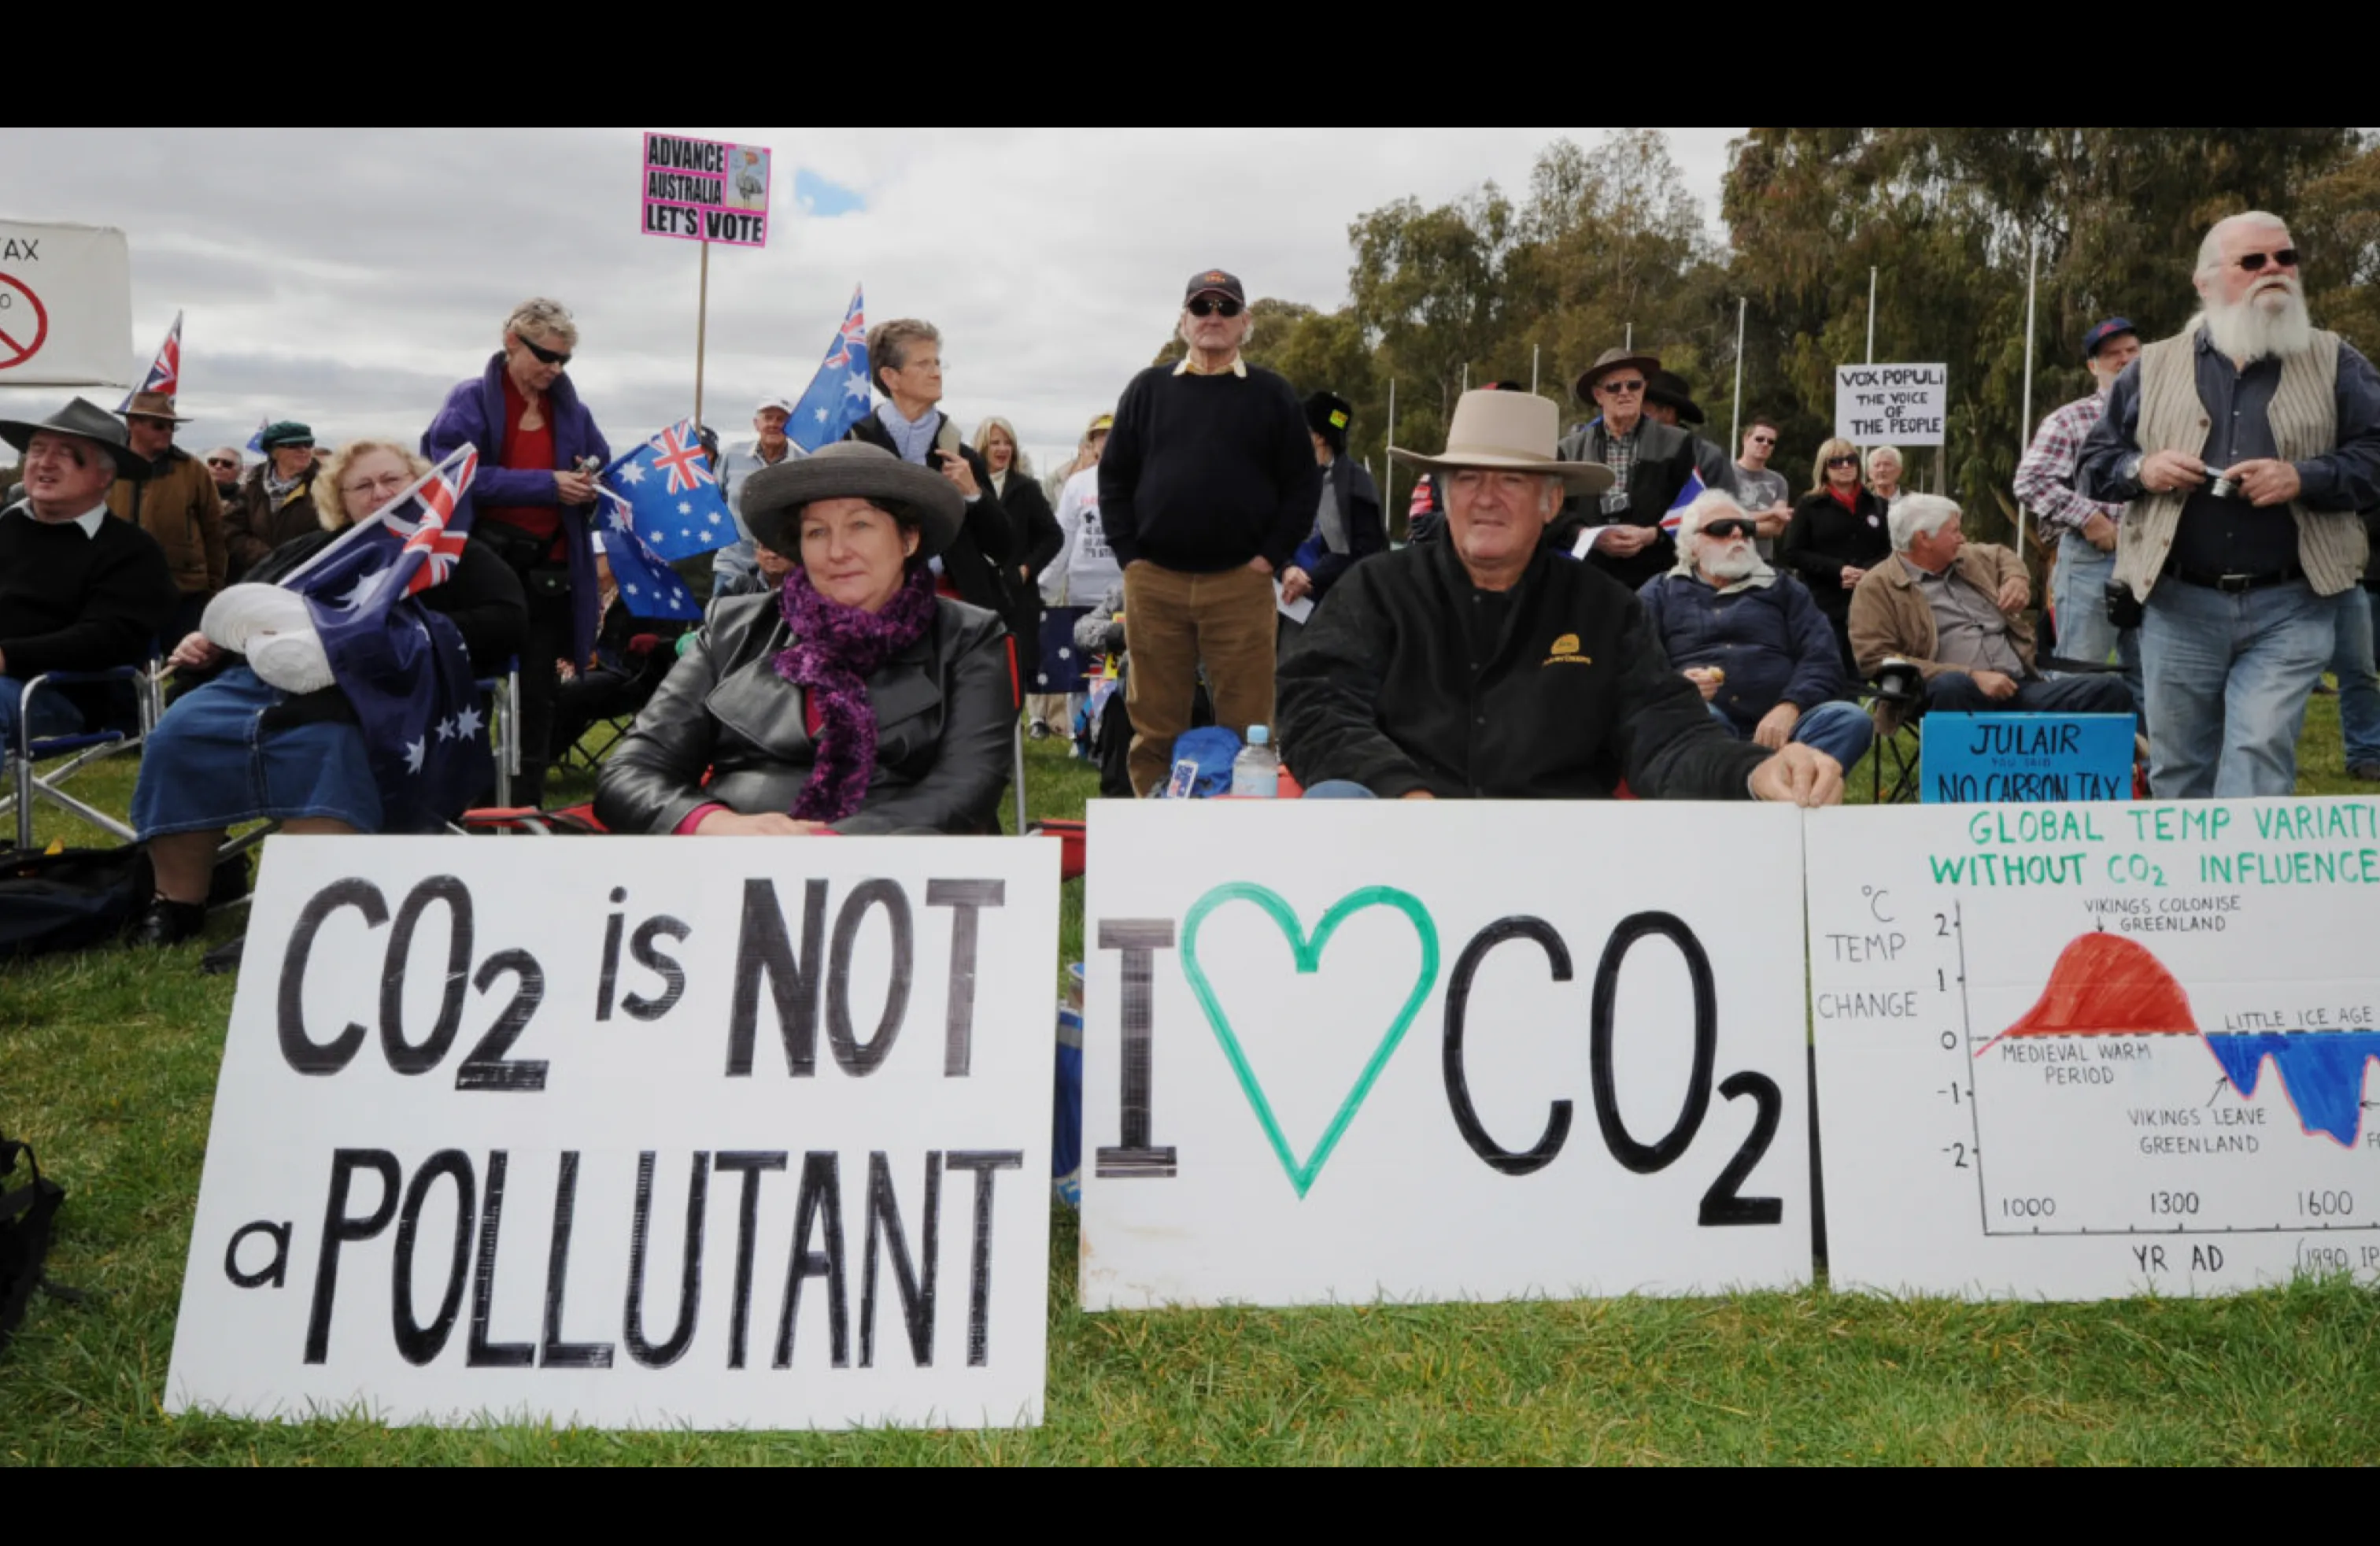
The interesting part isn't deciding whether the chart was “true” or “false”. It's seeing what happens when a scientific representation is separated from the conditions needed to interpret it: its caption, context, uncertainty, the sources of evidence and the limits of the representation. A schematic figure can then be recast as definitive proof and used to support a conclusion that the scientific work it came from does not support.
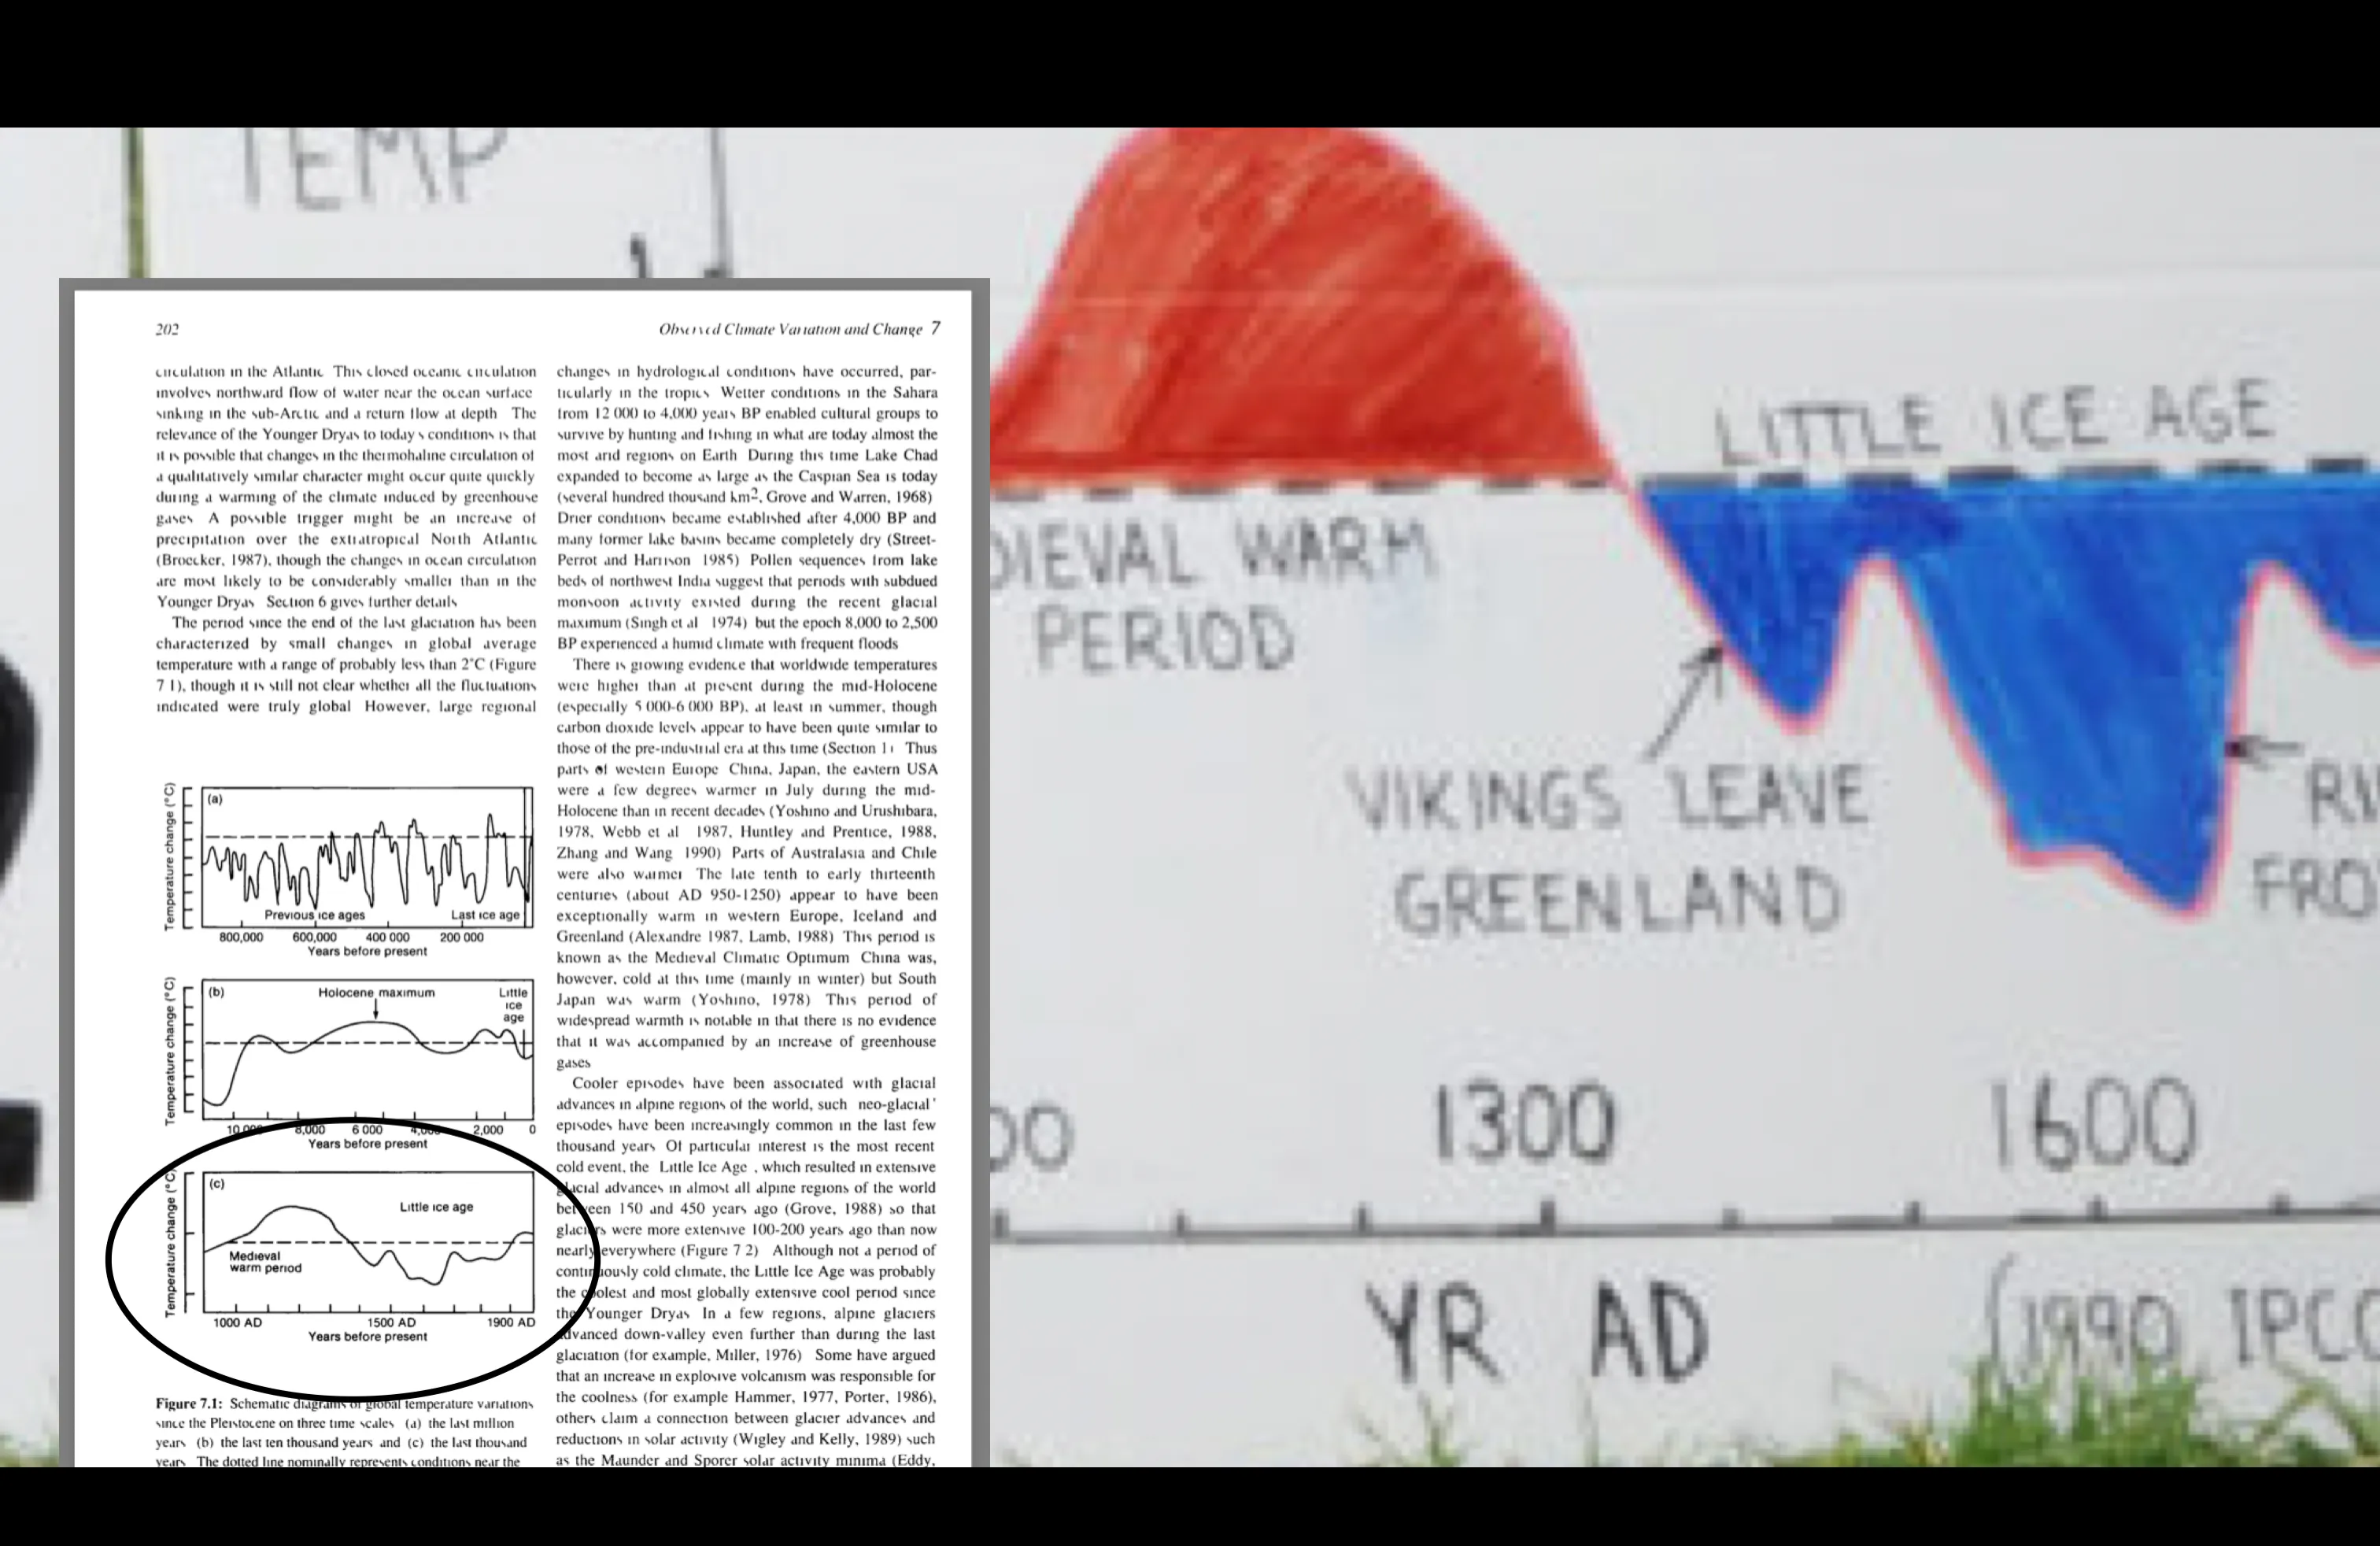
Image: composition by Sheldon.studio using IPCC, First Assessment Report (1990), figure 7.1, and the photograph by Torsten Blackwood / AFP via Getty Images (Canberra, 2011).
A chart doesn't have to be fake to produce a misleading reading. Sometimes all it takes is losing what surrounds it.
We have a fairly enormous data literacy problem here. We can publish all the data we like, make it downloadable and distribute it through open platforms, but we can't expect that to produce understanding automatically. Data doesn't speak for itself, and when it seems to, it's often because someone is speaking on its behalf.
The problem, then, is precisely opening up open data. If we want it to create value for everyone, we need to think about people who don't already have the skills to interpret it. Otherwise, openness risks creating value mainly for those who already know how to interpret and use that data.
For us, design works on this possibility: translating data, creating opportunities to connect with the phenomena it describes and giving people the tools to understand it. Three aspects we've come to call translate, relate, enable.
Translate
Think of an ultrasound scanner. The probe emits ultrasound waves and picks up echoes reflected by the body's tissues; the system processes them and translates them into points of light on a screen. Signals that, presented as a sequence of values, would be incomprehensible to many of us become an image of something we otherwise couldn't see.
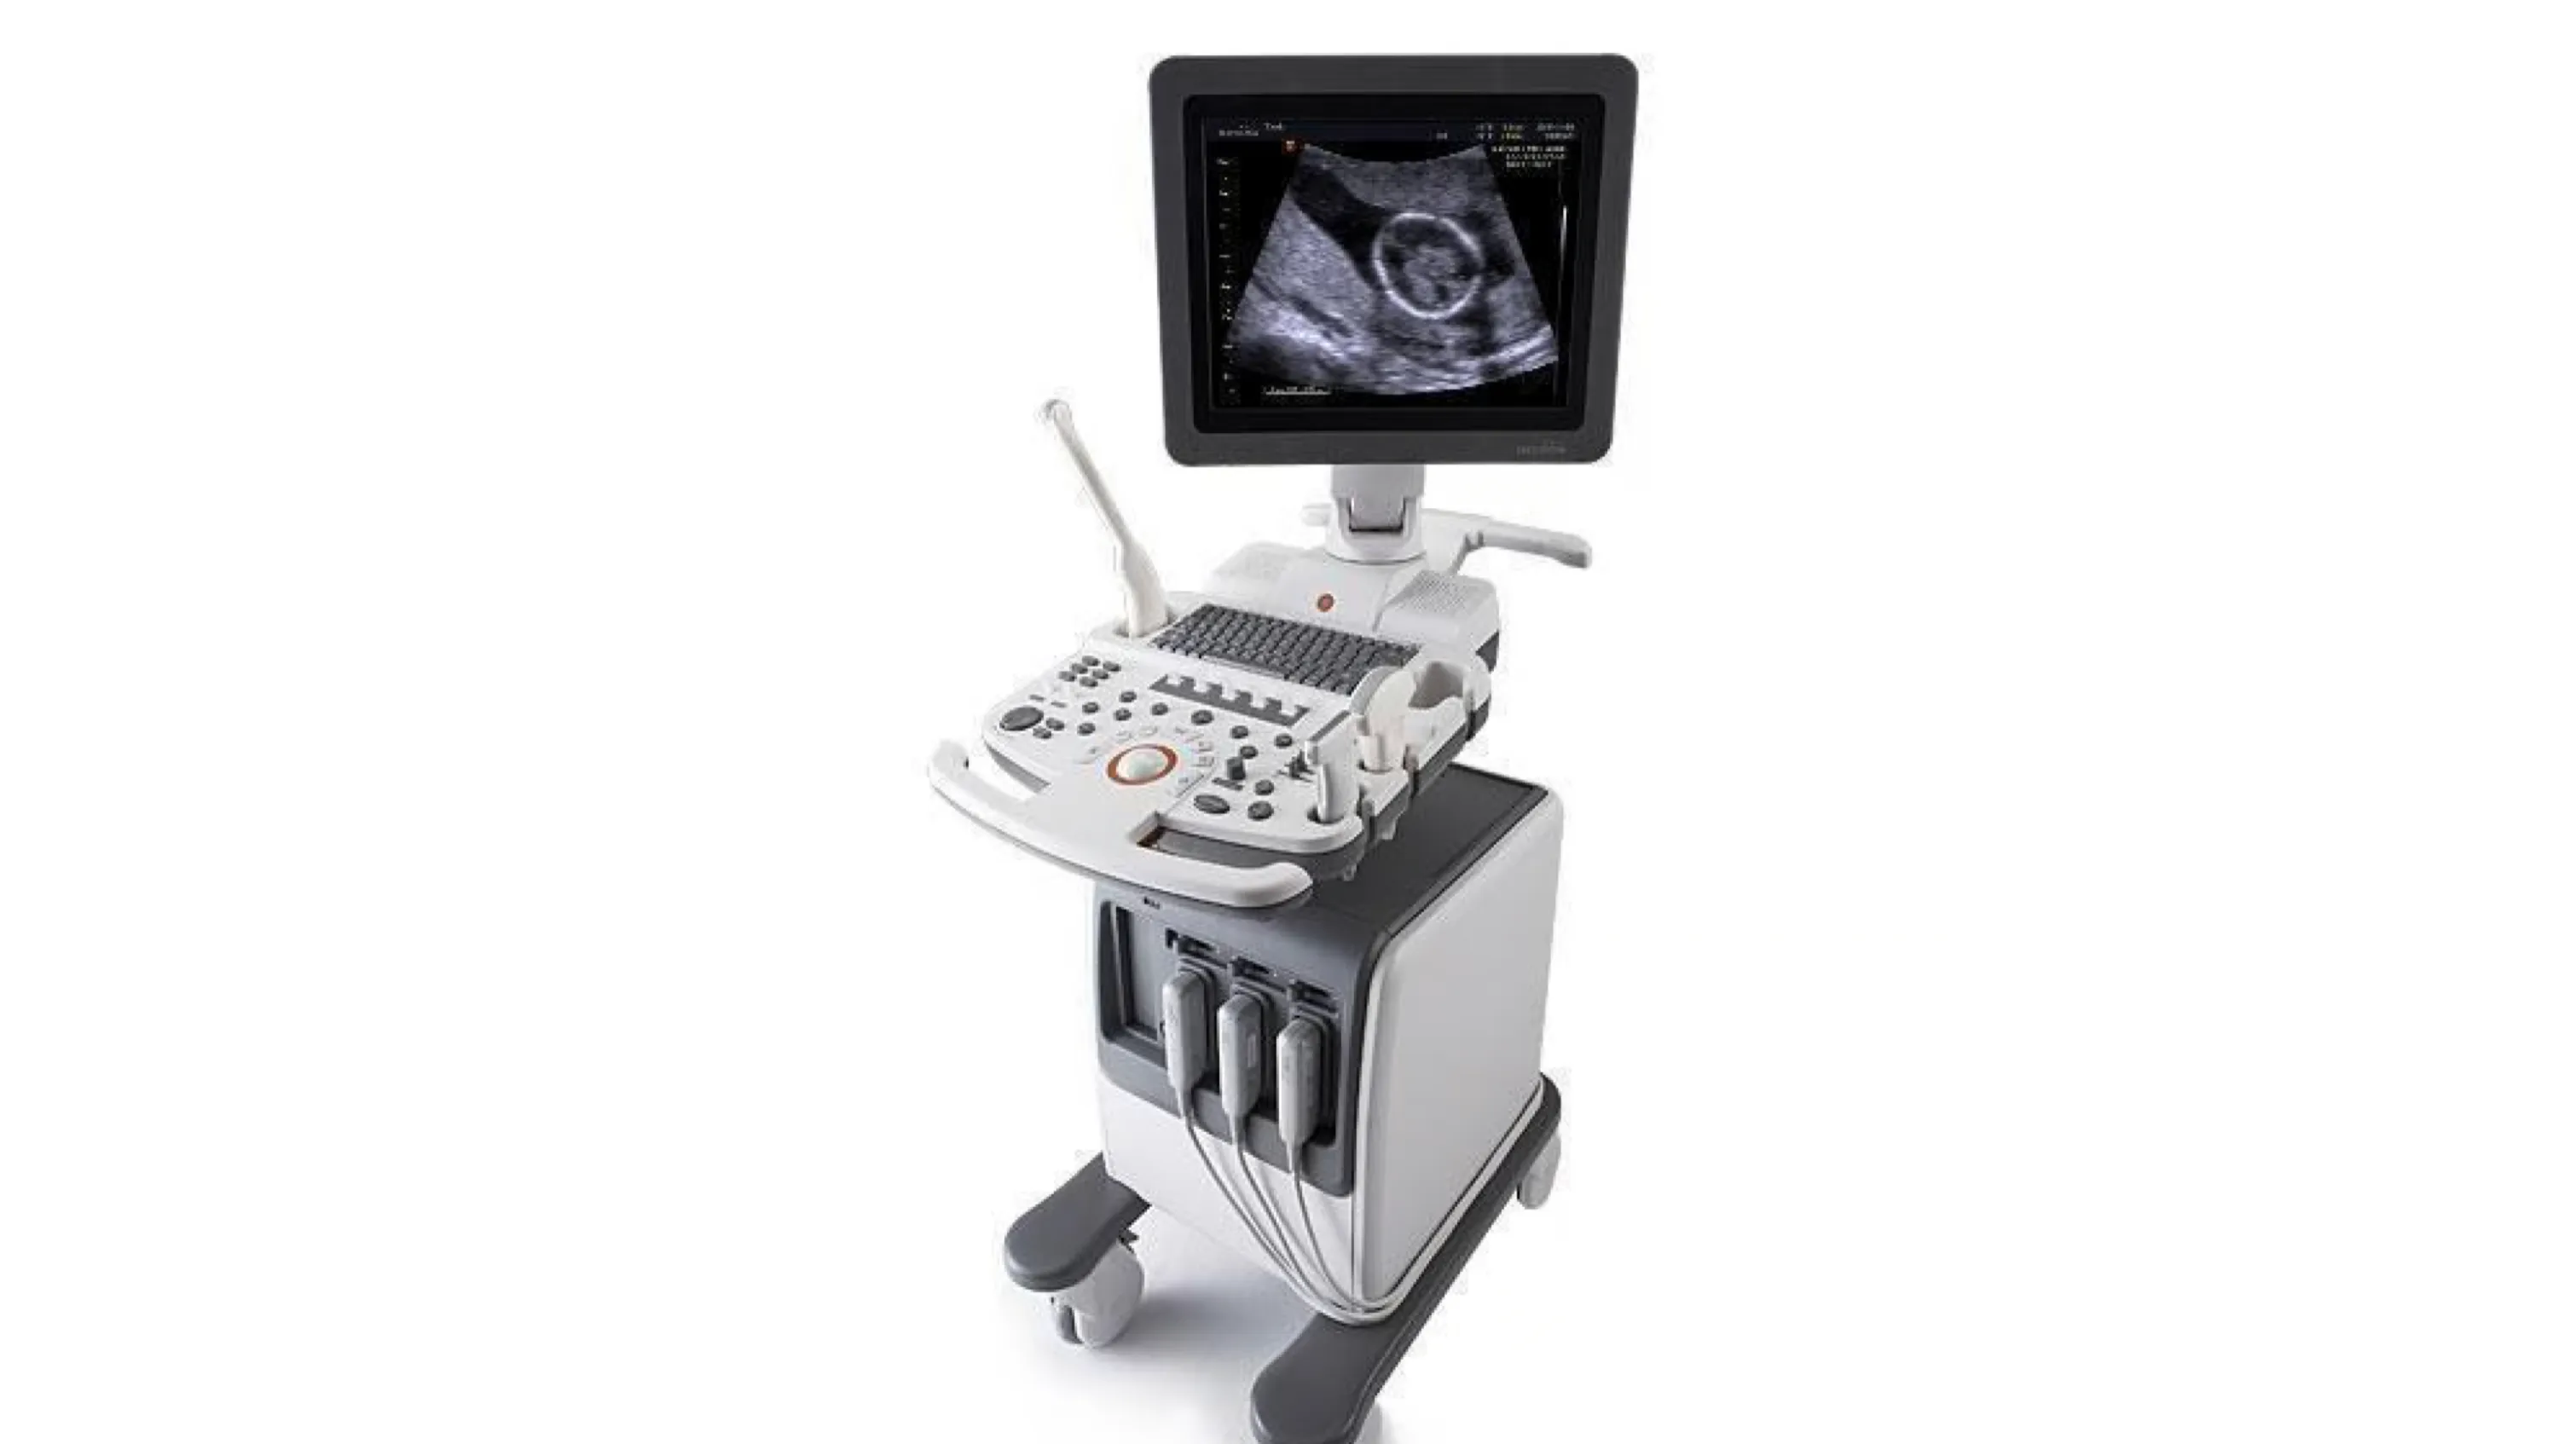
It's a translation: from signals into a form we can perceive, distinguish and explore. We do something similar with data when we turn values and relationships into positions, sizes and colours. We make a structure visible that would be hard to recognise in a table.
Having an image in front of us, though, doesn't mean we understand it yet. Anyone who has stared at an ultrasound image while nodding confidently knows what we mean.
Relate
Then we discover that the scan on the screen is of our child. Or we come across our own scan from before we were born, or someone shows us one of our niece or nephew. Suddenly the representation has something to do with us, someone we know, something we care about.

We haven't become any better at reading it, but our attention has changed. We want to look more closely, recognise something, ask questions. What looks like a greyscale smudge to someone else can become an image we keep for years.
Relate means creating opportunities for this connection to happen with data too: through a place, an experience, a question that concerns us. Translation makes the phenomenon visible; connection gives us a reason to care.
Enable
At some point, someone helps us read that image. An expert points to a shape, explains what it represents and distinguishes what can be observed from what cannot be inferred. And finally we stop nodding at random.

That explanation leaves us with something that goes beyond this particular image. At the next scan, we might find our way a little more easily, recognise a few elements and ask more informed questions. We don't become specialists, but we begin to understand how the representation works and what information it can provide.
That's what we mean by enable: giving people the means to understand. Designing tools, explanations and opportunities to learn that help people read data more independently, including the next time they encounter it. That also means knowing when to ask for help and when a conclusion goes beyond what the data allows us to say.
Opening up open data
The IPCC chart we started with brings us back here: a representation can be visible, attract attention and even become an argument to take to a protest, without its meaning and limits being understood.
Translating, creating opportunities to connect and enabling understanding are parts of the same work. This is how we can make the promise of open data tangible: creating value for everyone, including those who don't already have the skills to interpret it.
Publishing it was an essential step. Truly opening it up also means thinking about how people encounter it and learn to read it. The “download” button, unfortunately, can't do everything.
Follow us on
Instagram
LinkedIn
Spotify