
For quite a long time, we talked to computers by writing.
Anyone old enough to remember DOS, modems, and BBSs knows what we mean. There was text in front of you, often more text underneath it, and if you wanted to do something, you had to know what to type. The computer didn't make much of an effort to meet you halfway: you were the one who had to learn its language.
Then graphical user interfaces arrived, and little by little we started talking to machines in a different way. As early as the 1970s, systems like the Alto at Xerox PARC were experimenting with graphical displays, windows, menus, and the mouse; in the 1980s, Lisa and Macintosh would help bring that paradigm out of research labs and towards a much wider audience.
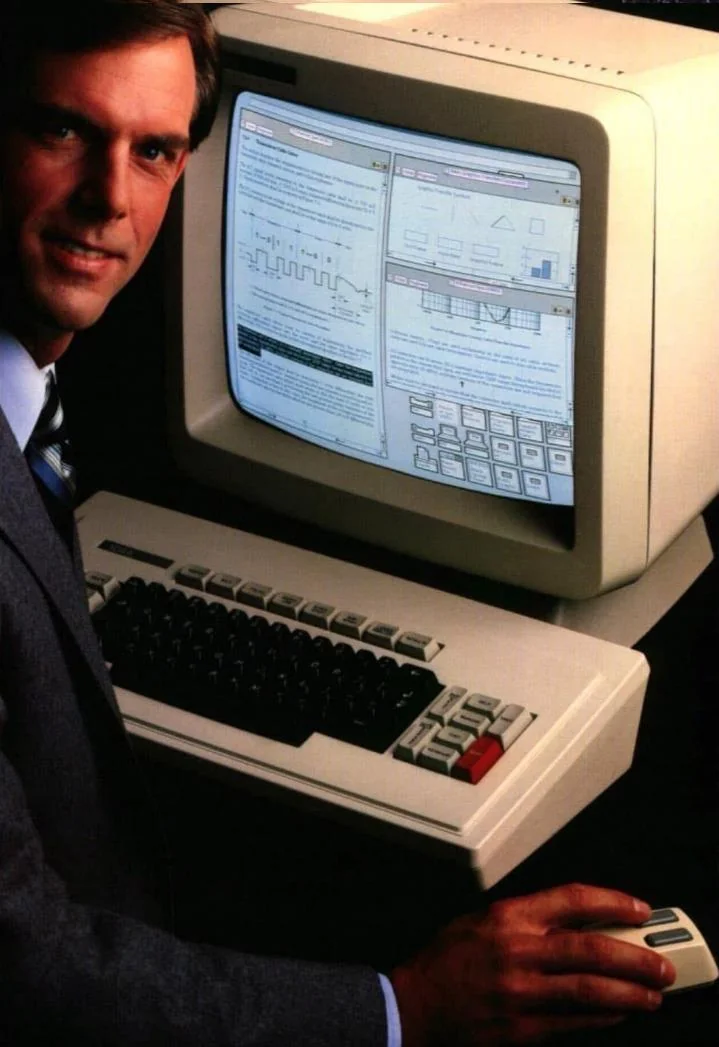
From that point on, many operations that had previously required a command became gestures. Files could be moved, windows opened and closed, objects dragged around, and things we no longer needed thrown into a trash can. Beneath the surface, the computer was obviously still doing very non-metaphorical things, but we could interact with it through desktops, folders, documents, buttons, and pointers.
For a few decades, we got used to the idea that making an interaction more accessible often meant making it more visual.
Today, at least in part, we are moving in the opposite direction.
Back to text
We can ask a machine to edit an image simply by describing what we want. We can tell it to remove the background, add an object, change the lighting, or alter the style of a photograph. Operations that until recently required selections, masks, layers, brushes, and a certain familiarity with an interface can now be handed over to a sentence.
Of course, we still have to learn how to write that sentence. We have replaced some knowledge of the interface with the ability to communicate effectively with an artificial interlocutor, which is not exactly the same thing as eliminating complexity. Still, when it works, it's hard to deny that it can be incredibly convenient.
And for those of us who spend quite a lot of time visualizing data, this leads fairly quickly to a slightly uncomfortable question: do we still need to visualize data?
The question is less provocative than it might sound.
Data visualization exists precisely because we are very good at seeing certain things that are much harder to find in a table. A distribution, an anomaly, a correlation, a distance, or a change over time can become apparent when numbers are translated into positions, sizes, shapes, and colours. It's one of the ideas at the heart of information visualization: using visual perception to make structures and relationships recognisable when they would be much harder to spot in raw data.
But a visualization is not an insight. It creates the conditions for us to find one.
A chart shows us a series of points, bars, lines, or areas organised according to a particular visual encoding. We then read, compare, and interpret them until we arrive at something we consider interesting. The insight is a possible outcome of that process, not the visualization itself.
This does not mean, of course, that a visualization is neutral. Quite the opposite. Someone has chosen which data to use, what to leave out, which scale to adopt, how to aggregate the information, what form the representation should take, and where to direct our attention. Even before the chart exists, there is a long sequence of decisions that we often cannot see.
Still, between the data and the insight, visualization leaves a space for interpretation.
What if we could skip that space?
What if we just ask?
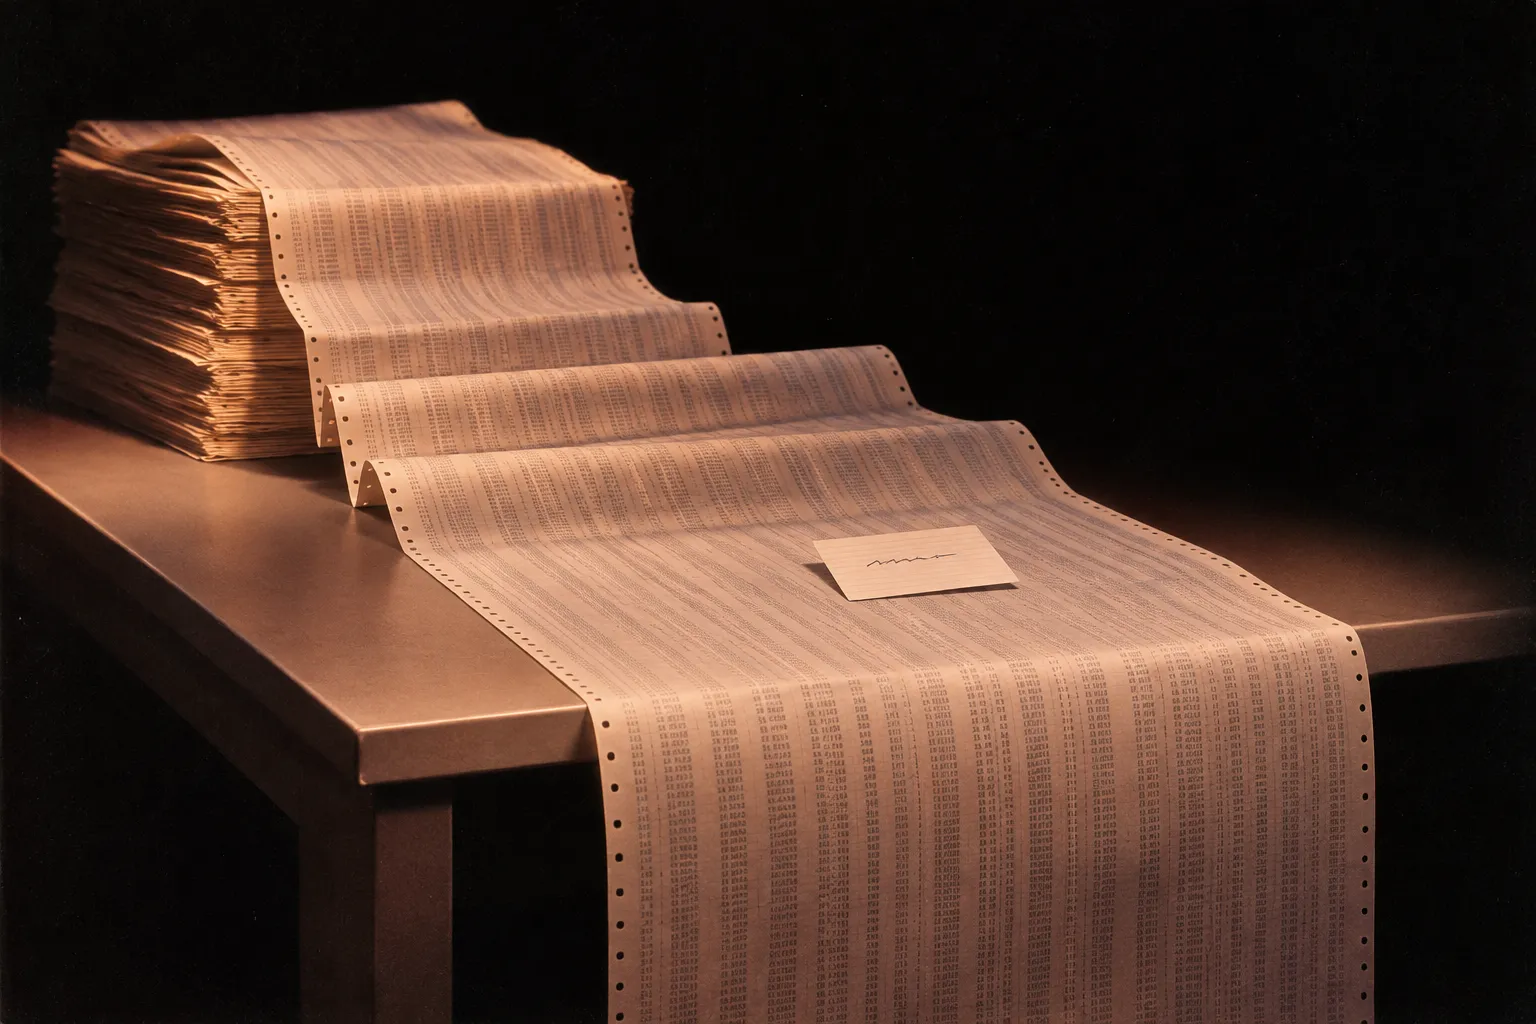
Imagine having a dataset with thousands of rows in front of us. We can visualize it, explore it, filter it, and look for interesting patterns. Or we can ask a system to do that for us and simply ask: "What's interesting in here?"
The difference is not trivial. A system can analyse the data and give us a verbal answer directly: this is increasing, these two phenomena seem to move together, there seems to be an anomaly here, this group behaves differently from the others. It can do this very quickly and without necessarily requiring us to know how to read a complex visualization.
That does not mean, of course, that what it gives us is relevant.
Using AI to analyse data means introducing into the process a tool with interesting possibilities and equally important limitations: it can misread a structure, confuse correlation with causation, get calculations wrong, or state with great confidence something that simply isn't in the data. And, perhaps most importantly, it can be difficult to understand the steps it took to reach a particular conclusion.
So the point is not to hand over a dataset and wait for AI to give us the correct interpretation, but to understand what happens when we delegate to a system part of the process through which we decide what, in those data, is significant. Used critically and with an awareness of its limitations, AI can substantially change the way we access data without removing the need to verify, understand, and question it. If anything, it makes those operations even more important.
Because there's something else that those of us who design visualizations occasionally tend to forget: you have to know how to read charts.
Not everyone has the same familiarity with axes, scales, distributions, scatterplots, choropleth maps, or network diagrams. Visualization translates numbers into a visual encoding, but that encoding still has to be decoded. Even the apparently simplest chart assumes a certain degree of graphicacy, just as working with data requires a certain degree of data literacy.
A verbal response can lower that barrier. But the moment we ask a system to tell us directly what is interesting, we are also delegating part of the analysis and interpretation.
And this is where things get interesting.
Show me the data. Or don't.
In a visualization, we can look at the full distribution, notice a point that doesn't quite fit, realise that a trend is less clear-cut than it first appeared, or simply spot something that the person who designed the chart hadn't anticipated.
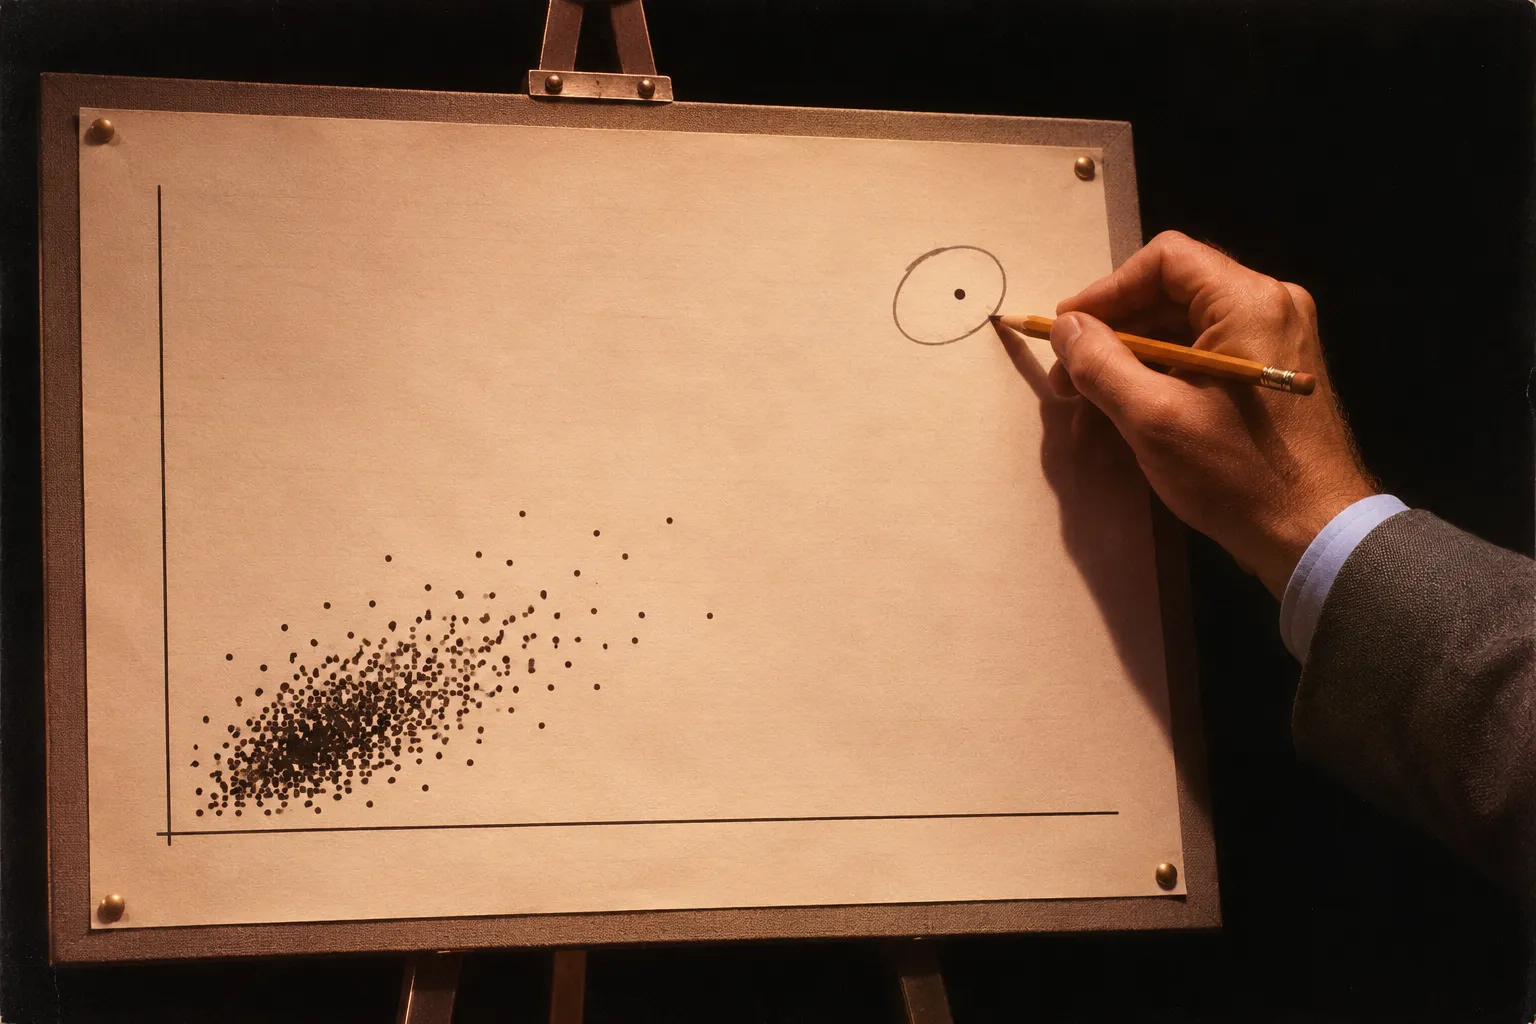
A verbal response does something different: it has already selected for us what is worth saying. If a system tells us that "most residents are under forty," we are no longer looking at the data and arriving at that conclusion ourselves. We are receiving a conclusion directly, and we have to decide how much to trust it, how to verify it, and whether we have enough information to challenge it.
On the one hand, this is a huge advantage because it lowers the barrier to entry. On the other, it introduces another layer of opacity between us and the data. Obviously, this opacity did not begin with artificial intelligence: a visualization also hides everything that comes before it, from collection and cleaning to classification, aggregation, and selection. A chart is not a transparent window onto data, and it never has been.
If we can get a first interpretation of the data simply by asking a question, visualization may become less necessary for reaching a first insight and even more important as a way to explore, verify, and challenge it. That argument, however, depends on one fairly important condition: the visualization cannot simply be another output from the same system to which we delegated the analysis.
If we ask AI to analyse the data, decide what is interesting, and then produce the chart we are supposed to use to check its interpretation, we have not gained much transparency. We have simply changed the format of the output.
Analysing or communicating?
There is, however, an ambiguity in the question we started with. When we say that we visualize data, we can mean at least two different things: we visualize it to look for something, or we visualize it to show something we have already found.
In the first case, visualization is an analytical tool. It allows us to explore a distribution, compare values, find anomalies, formulate hypotheses, and perhaps notice something we were not looking for. Here, the fact that a chart does not necessarily hand us a conclusion is part of its value: we can look at it, interrogate it, and find different things.
In the second case, we are communicating. We have already decided what we want to say and need to work out which form will communicate it most effectively. Here, visualization does not automatically beat text, just as text does not automatically beat visualization.
If we want to show how a series changes over time, compare twenty values, or make the distance between one point and the others immediately visible, an image can let us understand in a few seconds what might take several lines to explain. If, instead, we want to communicate a single insight, give it context, or explain why it matters, turning it into a chart can be an unnecessarily long way around, or vice versa.
So perhaps the point is not to decide whether language can replace visualization. It is to understand when seeing is a better way of understanding and when reading — or listening — is simply more effective.
With AI, this distinction becomes even more interesting. On the communication side, language can become an extremely accessible interface to data. On the analysis side, however, delegating the reading also means giving up part of the exploratory space in which we might find something the system did not decide to tell us about.
So, can we stop making charts?
Probably not, which is fortunate, considering it's what we do for a living. But perhaps we can stop assuming that visualization is always a necessary step between data and understanding.
We don't think AI will make data visualization obsolete. More likely, it will force us to be a little more precise about why we use it.
If we need to communicate a piece of information, we may find that in many cases a sentence works better than a chart, as we found with Barriera Mentale, while in others a visual form remains far more immediate than text. If, instead, we want to explore data, see distributions, exceptions, and relationships without knowing in advance what we are looking for, visualization continues to offer something different from an answer formulated by a system.
The interesting change, then, may not be the disappearance of data visualization, but the end of the assumption that visualization is necessarily the best way to access data.
Sometimes we will want an answer. Sometimes we will want to see what's there.
And those are two quite different things.
Follow us on
Instagram
LinkedIn
Spotify